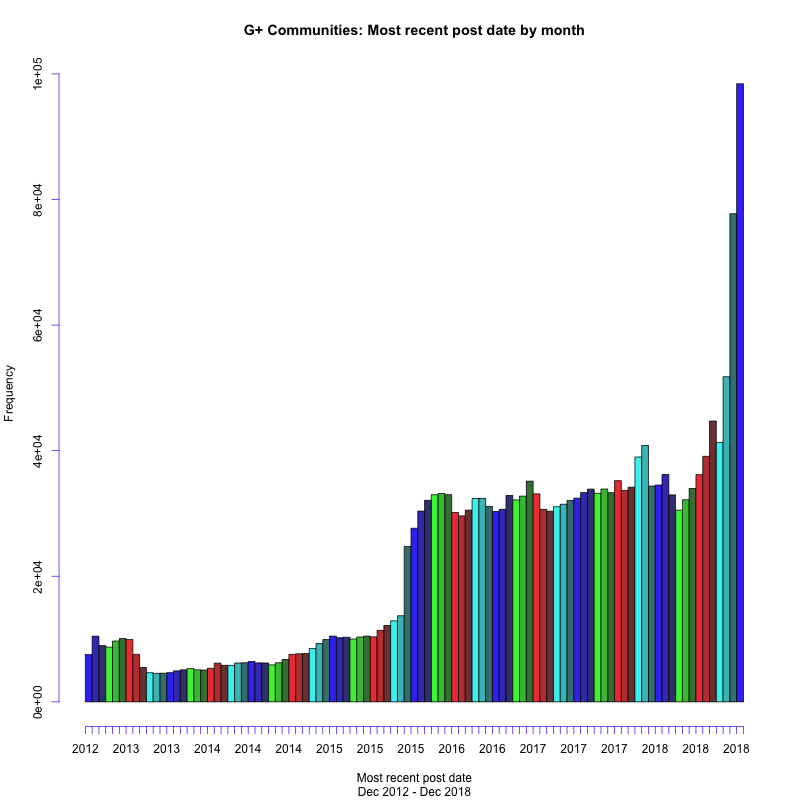
G+ Communities: Most Recent post date by month
I've expanded my cache of community data substantially and am playing with / torturing the data. One aspect I'd noted was a pronounced bump in community posts about 150-160 weeks ago, in, as it turns out, October of 2016. I'm still trying to puzzle over what this is -- if it's a bunch of communities which were purged, or shut down, or more recent posts removed or ghosted, or what.
You'll also see, that there's a long history of communities not seeing much activity. That's very consistent, and again, I'm not sure if this represents abandonment, purges, or what.
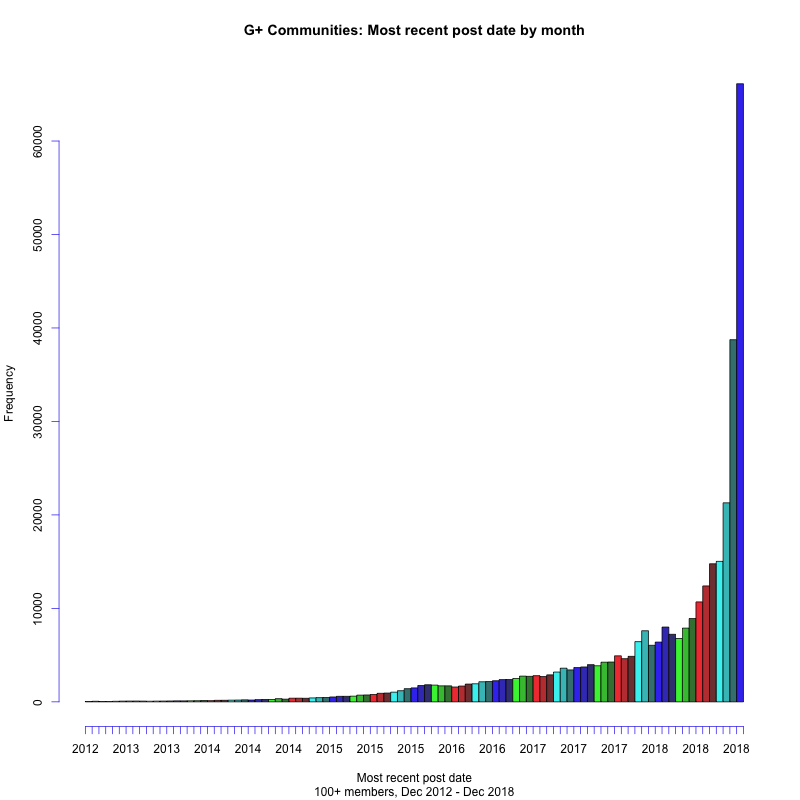
Both patterns largely disappear if we filter for larger communities -- the second graph shows the recency curve for communities with >100 members. Though whether this means the trailed-off communities were always small, or if their posts (and/or their members) left or were removed from G+, isn't clear.
There's also a pretty clear trend of a few thousand G+ communities being created on a roughly daily basis, so this could represent new-community-creation churn.
Again, this is not the history of posting activity over time -- I simply don't have the data for that -- but rather, a visualisation of G+ communities showing them by when the most recent visible surviving public activity is.
The colors here are banded by month -- blues start in December, greens in March, reds in June, cyans in September, to help distinguish seasonal/annual patterns in data.