Finally submitted a paper which has been basically ready to go since February :
A FITS viewer providing multiple techniques for astronomical data visualisation in Blender
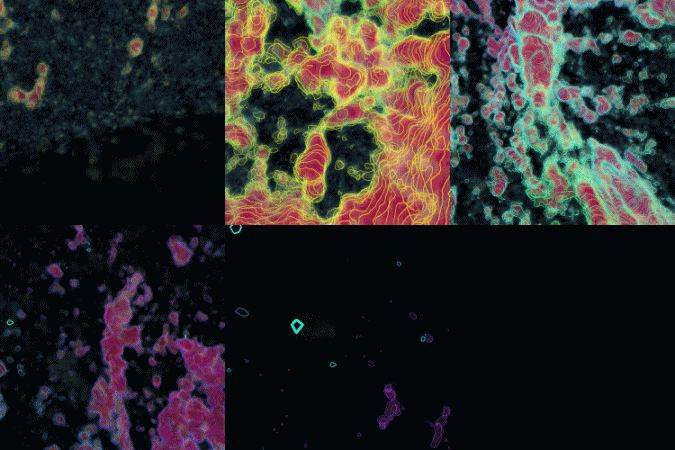
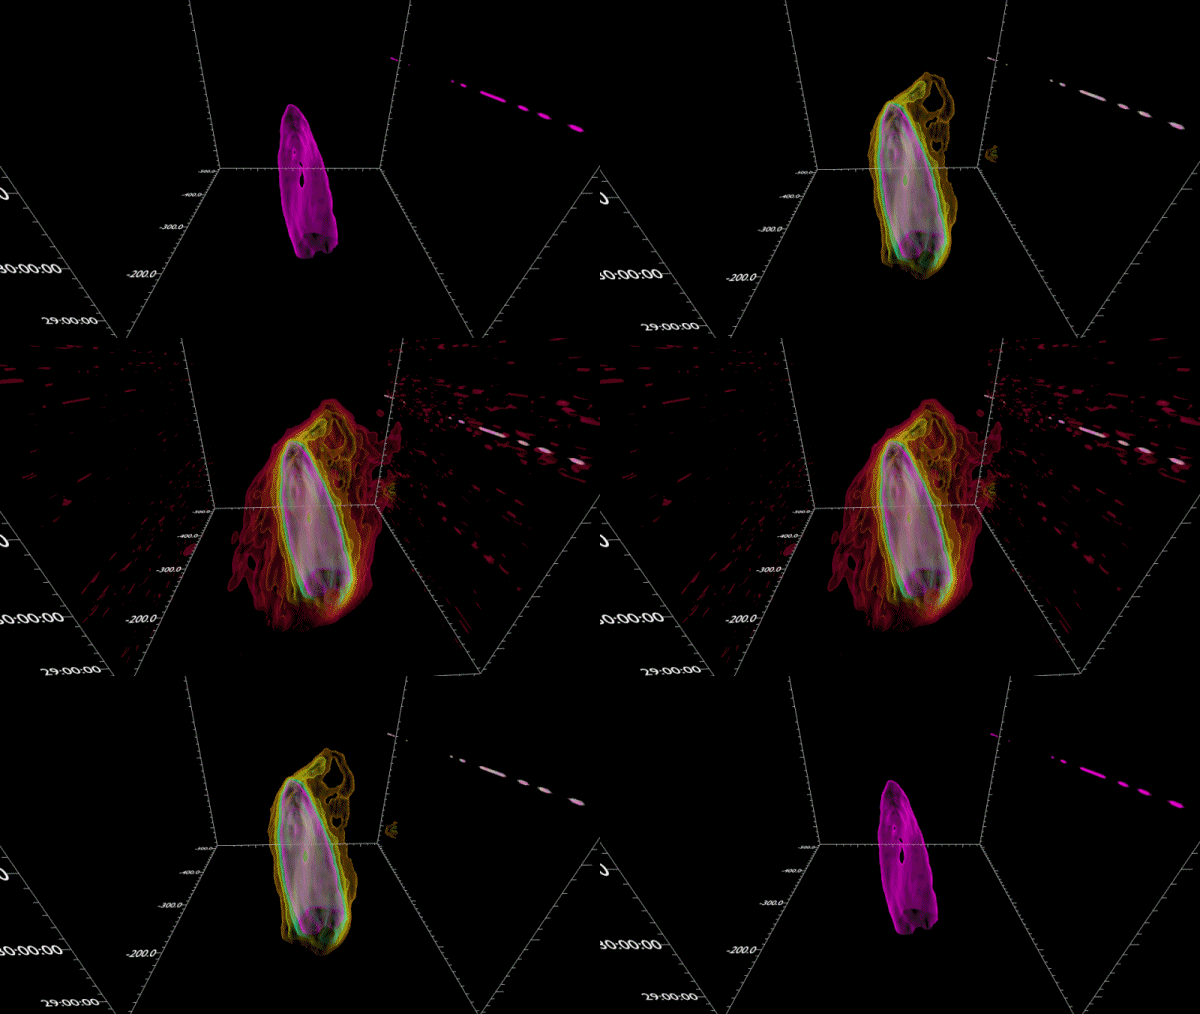
I present a new version of FRELLED, the FITS Realtime Explorer of Low Latency in Every Dimension. This is a 3D data visualisation package for the popular ‘Blender’ art software, designed to allow inspection of astronomical volumetric data sets (primarily, but not exclusively, radio wavelength data cubes) in real time using a variety of visualisation techniques. The suite of Python scripts that comprise FRELLED have been almost completely recoded and many new ones added, bringing FRELLED’s operating environment from Blender version 2.49 to 2.79. Principle new features include : an enormously simplified installation procedure, a more modular graphical appearance that takes advantage of Blender 2.79’s improved interface, much faster loading of FITS data, support for larger data sets, options to show the data as height maps in 2D mode or isosurfaces in 3D mode, utilisation of standard astropy and other Python modules to support a greater range of FITS files (with a particular emphasis on higher-frequency radio data such as from ALMA), and the capability of exporting the data to Blender 2.9+ which supports stereoscopic 3D displays in virtual reality headsets. In addition, in-built help files are accessible from each menu panel, as well as direct links to a complete wiki and set of video tutorials. Finally, the code itself is much more modular, allowing easier maintainability and, over the longer term, a far easier prospect of migrating to more recent versions of Blender.
The main hold-ups have been waiting for feedback from colleagues and, to a less extent, finding a journal. I’ve given up prompting and decided to the caution to the wind regarding the former; it’s a single-author paper, and such comments as I did get were along the lines of “seems fine to me”.
The latter is… uglier. The original version of the code was published in Astronomy & Computing, and in the halcyon days of 2015 this was free. Of course, every journal under the sun has switched to “open” (open ! HAH !) access, which mains that would now cost $2900. We can’t afford that - it’s simply a silly price. Which is a shame because A&C is an ideal journal for this kind of thing. So now I’ve tried A&A, which is more geared towards science papers rather than code, but has the tremendous virtue of being free because we subscribe to it. So, we’ll see - not sure this is the right journal, so this might be an awkward refereeing process.
(The code, of course, is here : http://www.rhysy.net/Code/Software/FRELLED/)
#Science
#DataVisualisation


