2 Likes
#weatherstation
3 Likes
5 Likes
1 Shares
3 Likes
5 Likes
2 Likes
DIY Weather Stations are an ideal way to spark an interest in Science for Learners

These are fully functional Sparkfun weather stations that require no soldering to assemble. They are based around the very cheap BBC micro:bit processor. The weather station can read temperature, humidity, pressure as well as light level, soil moisture and temperature, wind direction and speed, and also has a rain gauge.
Building a weather station is a practical project that helps unlock an interest in science, and the micro:bit processor also forms the heart of many more such DIY projects.
In South Africa I see the kits and parts are all available at Communica for purchase at https://www.communica.co.za/products/spf-climate-kit-for-micro-bit.
See https://learn.sparkfun.com/tutorials/microclimate-kit-experiment-guide
#Blog, #microbit, #schools, #science, #technology, #weatherstation
3 Likes
One person like that

8 Likes
1 Shares
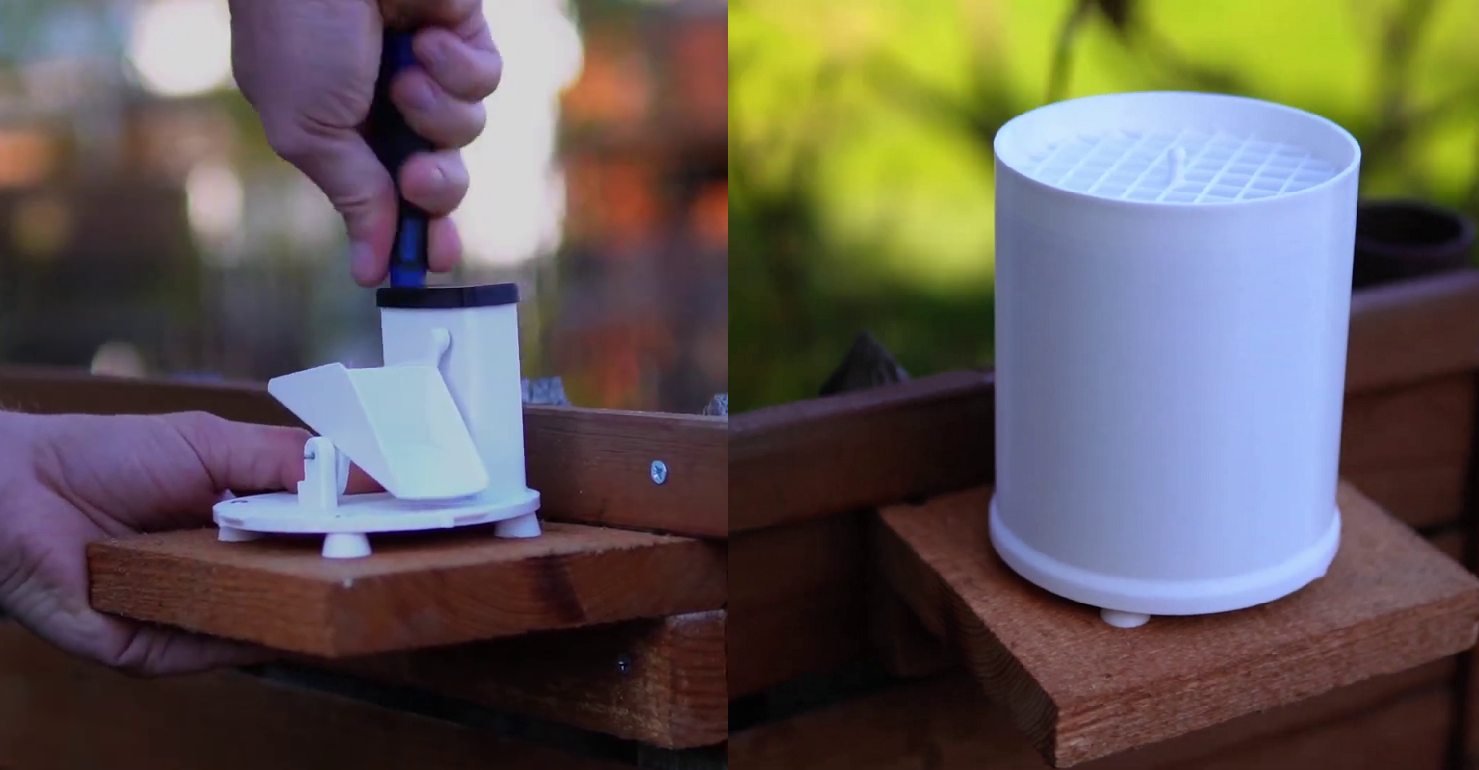
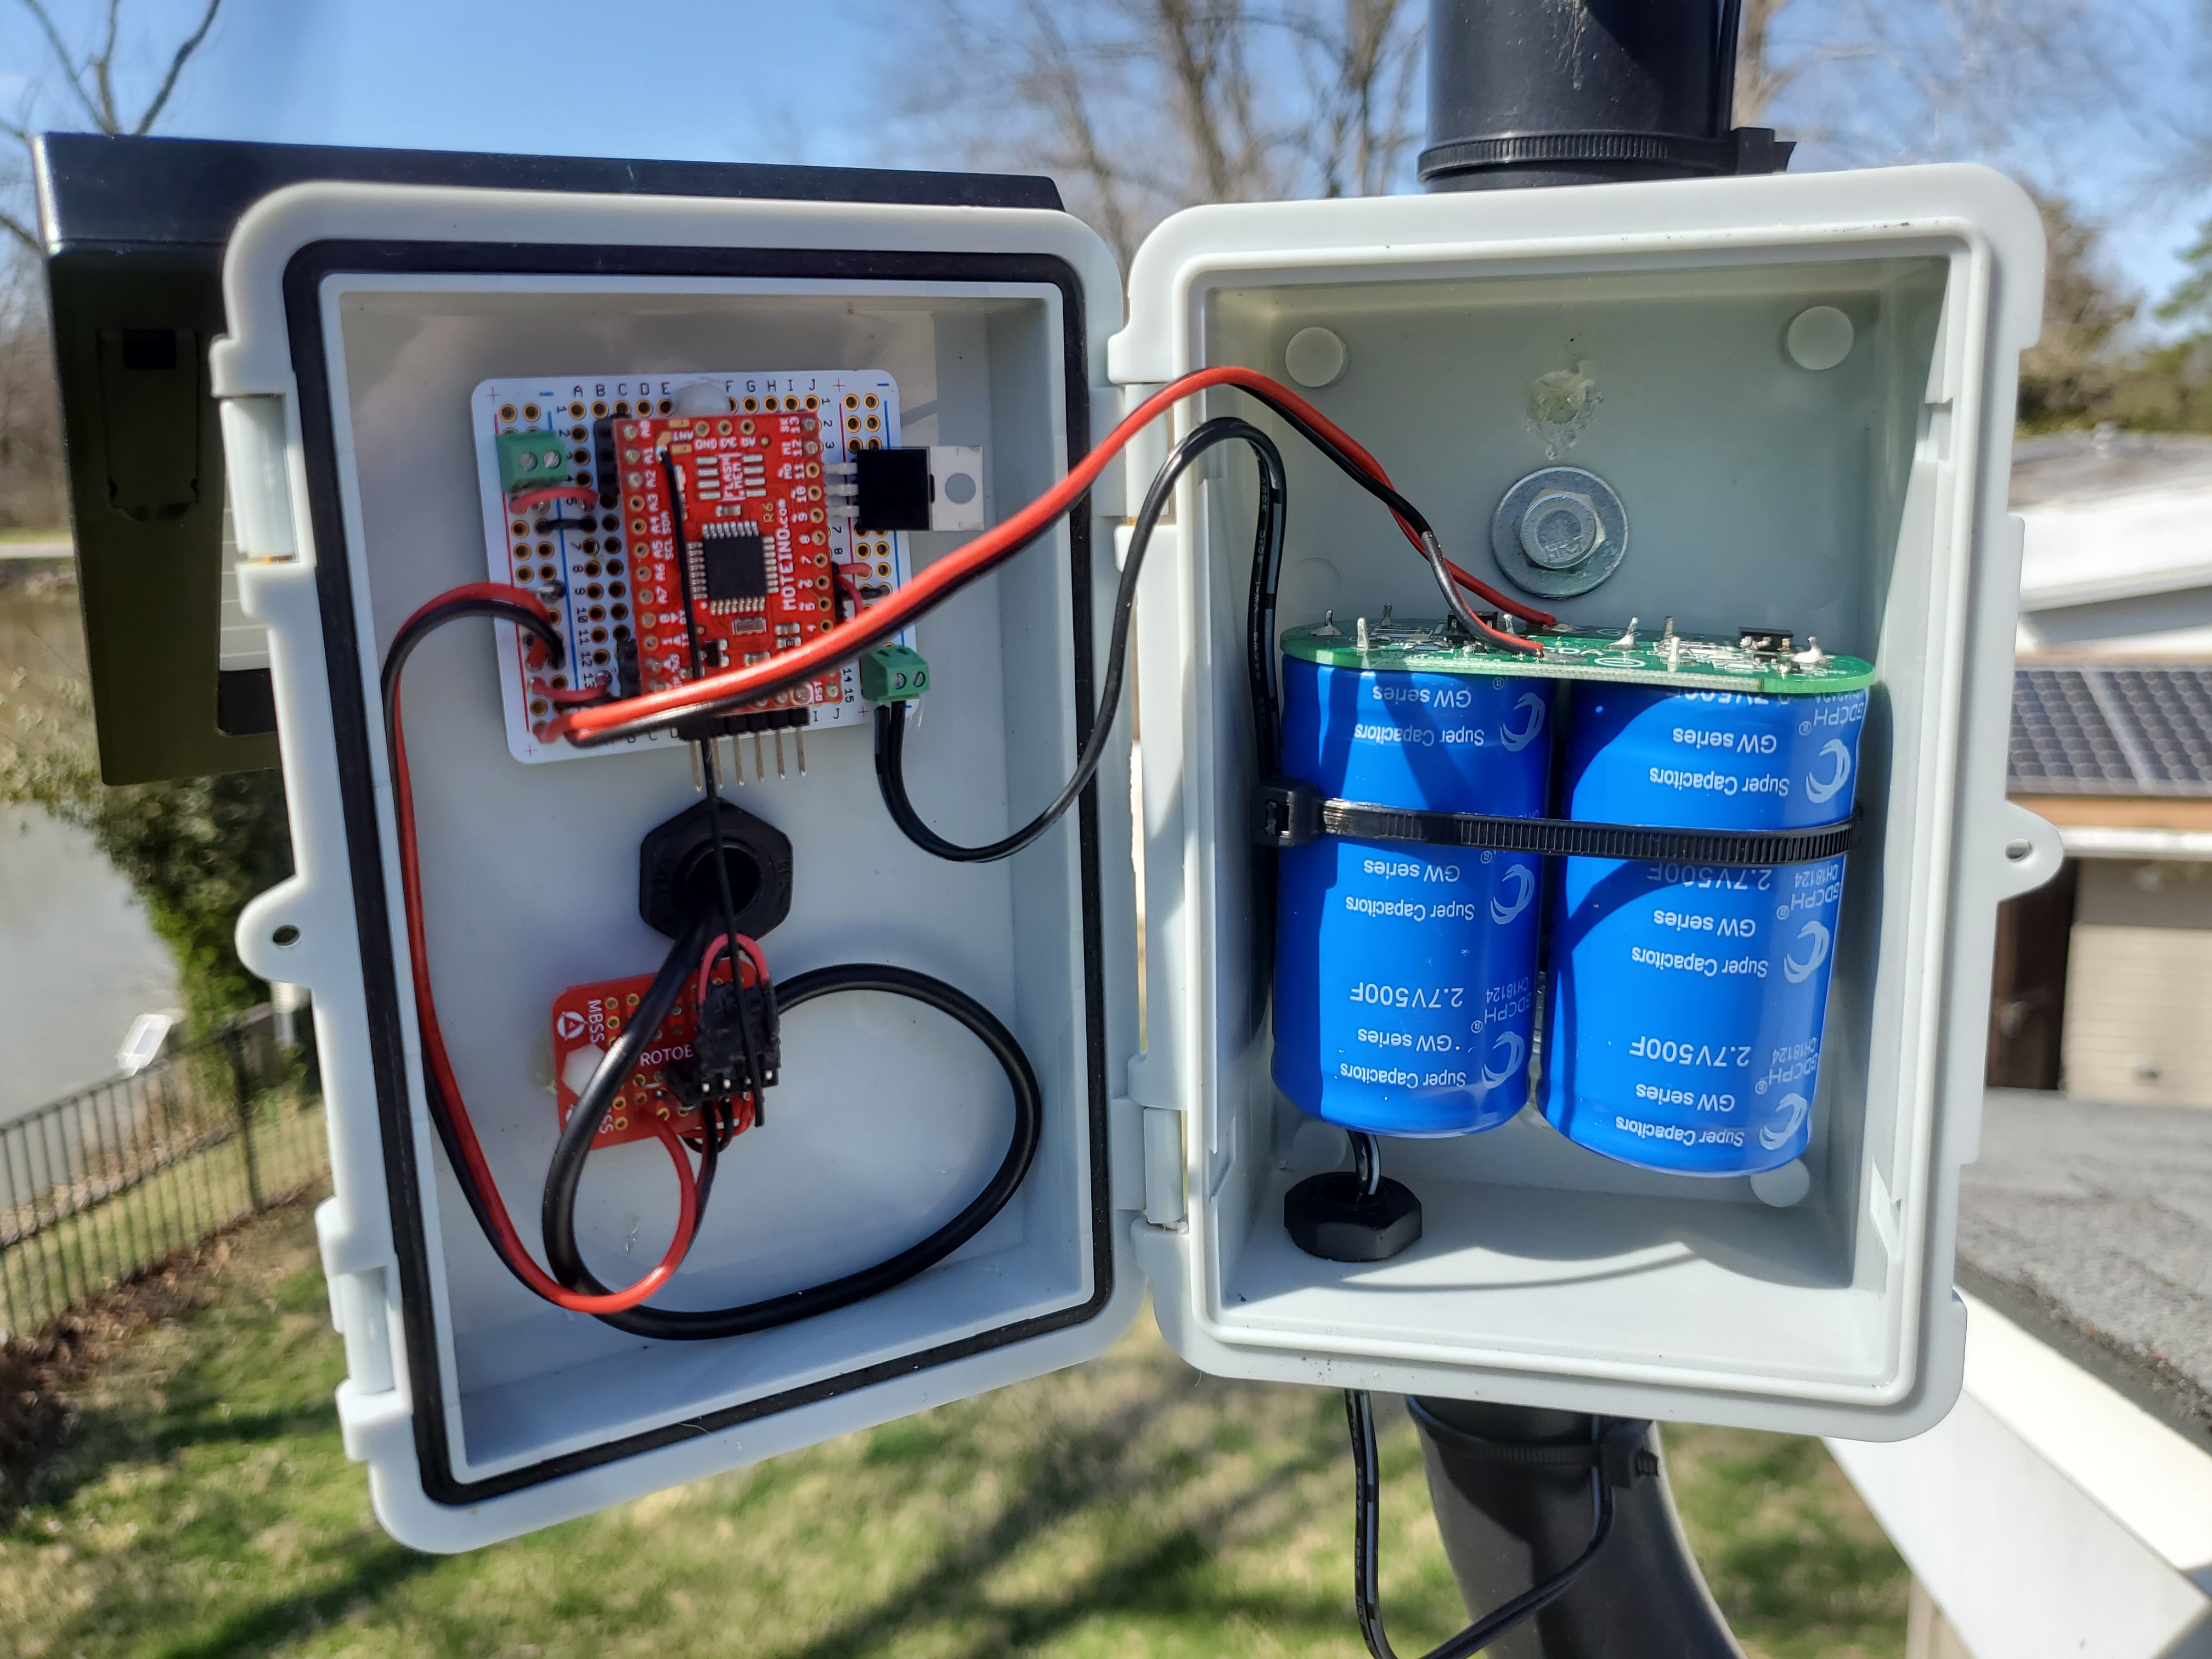
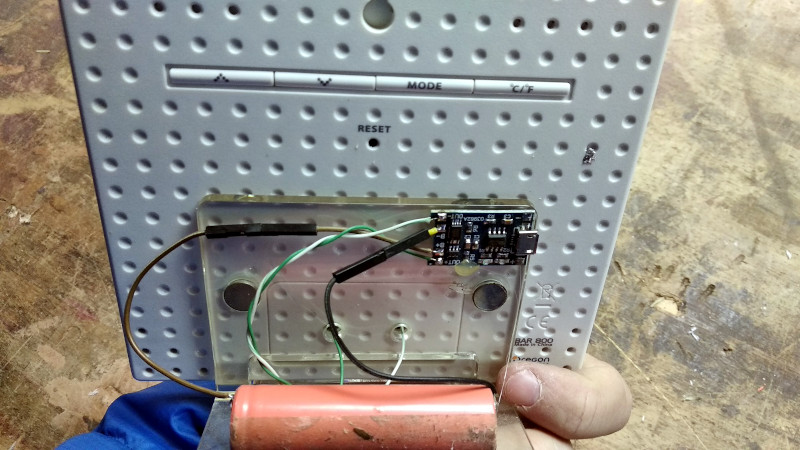
Wireless Weather Station gets Solar-Powered Supercap Upgrade

Supercaps are certainly not a drop-in replacement for rechargeable batteries, but it can get irritating having to climb onto a roof every few months to switch out the rechargeable batteries. My latest Ambient Weather station is using expensive single use batteries which last about 2 years, so I’m living with it, but my previous Acurite 5-in-1 station was also chewing through rechargeable batteries.
Supercaps do charge very quickly, and their lifetime use can be a good 30% or longer than rechargeable batteries. But they take up more space, and they discharge linearly, so other allowances need to be made for their use. But even so they may be worth considering for some use cases.
Using supercaps though for this weather station example, the monitoring device is showing that the supercaps were fully charged in just an hour and a half on a sunny morning, and maybe three or four times that on a dark and rainy day, which is pretty good.
See https://hackaday.com/2022/04/07/wireless-weather-station-gets-solar-powered-supercap-upgrade/
#technology #supercaps #weatherstation #PWS #batterylife
#Blog, ##batterylife, ##pws, ##supercaps, ##technology, ##weatherstation
One person like that
One person like that
SparkFun provides a very basic Weather Meter Kit for a DIY personal weather station
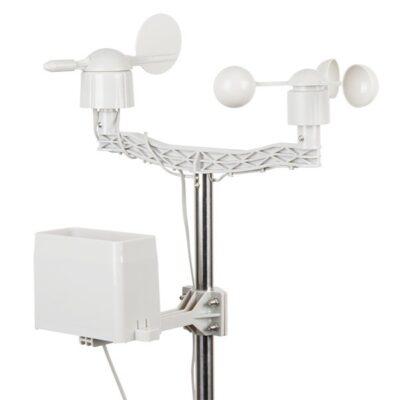
This is actually a very basic kit, containing just the sensors and mounting parts. It will produce the expected voltages, which you need to interpret, to read rainfall, wind direction, and wind speed. These are also the sensors which are the most specialised, as it is easy to source other sensors for temperature, air pressure, solar radiation, and even air quality (they do have some other sensors too for air pressure etc, but these need to be mounted in enclosures).
The intention is that this would operate with something like an Arduino (or a Raspberry Pi), which would measure the voltages and run the software to display output. On SparkFun’s site there is also a tutorial titled ‘Arduino Weather Shield Hookup Guide V12’ which gives a suggestion around components and software. It’s open source, so you can decide to do it any way you want to, and experiment with it.
See https://www.sparkfun.com/products/15901
#technology #PWS #weatherstation #opensource #sparkfun
#Blog, ##opensource, ##pws, ##sparkfun, ##technology, ##weatherstation
2 Likes

3 Likes
4 Likes
One person like that
1 Shares
How The Hunga Tonga Volcano Eruption Was Felt Around The World

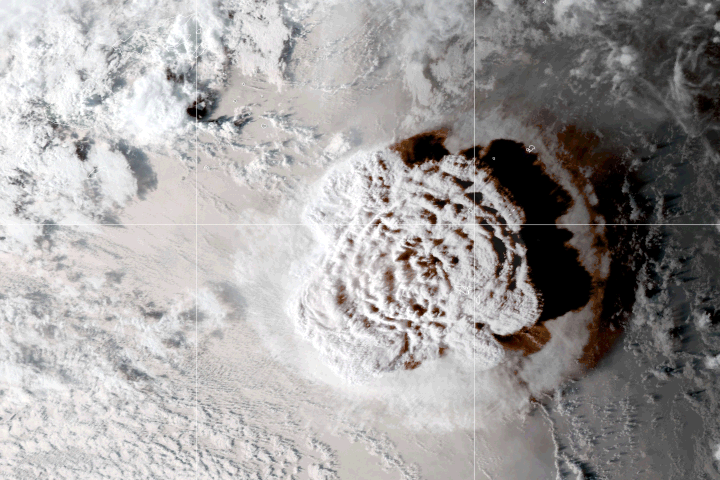
On the 14th of January, 2022, the Hunga Tonga-Hunga Ha'apai volcano began a gigantic eruption that would go on to peak in ferocity the next day. The uninhabited island volcano would quickly make headlines as the country of Tonga was cut off the world and tsunamis bore out from the eurption zone.
In a volcanic event of this size, the effects can be felt around the world. With modern instruments, they can be properly understood too. Let's take a look at how the effects of the Hunga Tonga eruption were captured and measured across the globe.
Far-Flung Effects
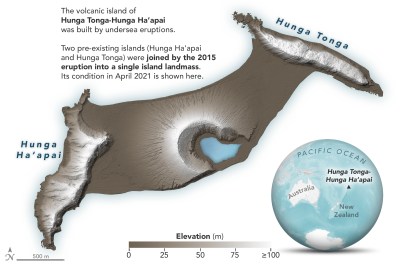 The state of the Hunga Tonga-Hunga Ha'apai island in April 2021. Credit: NASA
The Hunga Tonga-Hunga Ha'apai volcanic island that erupted in January bears two names because it was originally two separate islands that had become connected by volcanic activity back in 2015, so you know this is a geologically active region. However, the eruption this time was so ferociously powerful that the island was almost entirely destroyed, with satellite images taken in the aftermath shown only a small segment of high ground remains in the area.
In the wake of the event, NASA reported that the eruption was hundreds of times more powerful than the atomic bomb dropped on Hiroshima in World War II, roughly the equivalent of 4-18 megatons of TNT. Ash was sent high into the atmsophere, potentially up to a height of 50 kilometers, to the point where the cloud could readily be photographed by astronauts on the ISS.
Sensors Everywhere
 The pressure wave from the Tonga eruption as captured by the NOAA's GOES-WEST satellite's infrared radiance data. Animation credit: Mathew A Barlow, University of Massachusetts Lowell, usage approved with attribution
However, one needn't have the instruments and infrastructure of a national space program to detect such a large event. One [Edward Jensen] reports that his own weather station in Phoenix, Arizona captured a pressure anomaly from the eruption, as did other amateur weather installations in the area. This could be dismissed as an anomaly, of course, but the data checks out.
In fact, with pressure altimeter readings from national meteorological networks collated by [Daryl Herzmann], one can clearly see the pressure wave from the eruption passing over the continental United States on the afternoon of January 15. The National Weather Service also concurs with their own analysis, showing how the pressure wave reached stations as far-flung as Salt Lake City, Utah and Glasgow, Montana. Effects weren't just seen in wiggling graphs of weather data either; the volcano was credited with lifting the fog in Seattle as the pressure wave passed by.
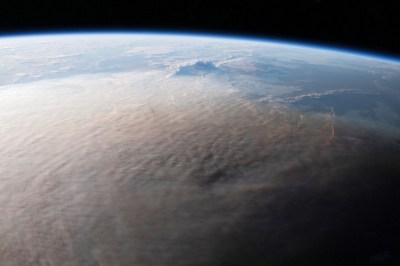 Ash from the eruption was lofted high into the atmosphere. This photo of the eruption was taken from the International Space Station. Credit: NASA
Distributed networks of sensors are particularly useful for tracking events like these; we've attempted to use similar methods ourselves to investigate nuclear incidents, albeit without success. Incidentally, though, the powerful blast of the Hunga Tonga eruption was picked up at all 53 infrasound monitoring stations maintained by the Comprehensive Nuclear Test Ban Treaty Organisation, highlighting that the event really was on the scale of a nuclear detonation.
Earthquake sensors were able to pick up the rumblings from the eruption, as you'd expect. The US Geological Survey released images on Twitter showing how seismographs at Mount Hood, Oregon recorded the event. Meanwhile, tsunami warning systems were triggered around the Pacific. Studies suggest that while tusnami waves were detected on many shores far from Tonga itself, such as in Peru and Japan, these were likely generated by the interaction of the atmospheric pressure wave with the water, rather than being generated by earthquake events themselves.
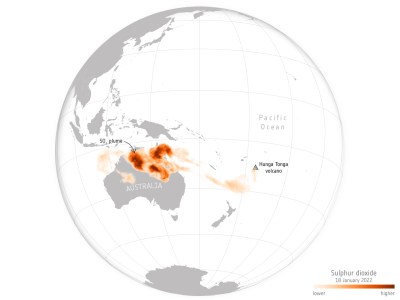 Data captured by the ESA's Copernicus Sentinel-5P pollution monitoring satellite showed sulfur dioxide released from the eruption passing over Australia in the days after the event. Credit: ESA, CC BY-SA 3.0
Outside of the waves from the event, other lingering effects from the volcanic activity have spread around the world. The Copernicus Sentinel-5P mission captured a giant sulfur dioxide plume from the eruption which had floated its way over to Australia by the 18th of January. The satellite is dedicated to pollution monitoring, and is designed to track aerosols and trace gases in the atmosphere. Thus, it was the perfect tool for monitoring the progression of the gas cloud as it travelled 7000 km in just a few short days after the eruption.
Did You Hear That?
Perhaps most amazing, though, are the report that the volcanic event could be heard as far away as Alaska, almost 10,000 km from the epicenter of the eruption. In a report from _Alaska Public, _residents talk about being woken on Saturday morning to loud booming noises. Travelling at the speed of sound - around 1225 km/h at sea level - the noises were heard around eight hours after the eruption kicked off.
For an eruption like this, detectable on a global scale, the Hunga Tonga event wasn't nearly as bad as it would have been if the island were inhabited. Sadly, still five deaths and eighteen injuries have been reported in the aftermath, with many still missing. Communications were cut due to a damaged undersea cable, and ash covered much of the surrounding area. Thankfully, aid was quickly deployed from surrounding countries.
Being forewarned would be better than cleaning up after the fact, though, and volcano eruption prediction is still an open research question. The hope is that data gathered in situations like these will better educate us and help us better mitigate the damage from similar events in future.
[Banner image: NASA Earth Observatory footage. Go check out their animated GIF!]
#currentevents #featured #science #citizenscience #environment #hungatonga #pressurewave #satelliteimagery #volcano #weatherstation
With the 1 minute interval ASOS data now available, I tried a dataviz idea showing sparklines for each station's 15 minute pressure altimeter. Thoughts? seems to nicely show the smaller wave action after the initial passage. #Tongaeruption https://t.co/n1JzZPwIjH pic.twitter.com/yLcB9l0LDm
— daryl herzmann (@akrherz) January 16, 2022
One person like that
One person like that
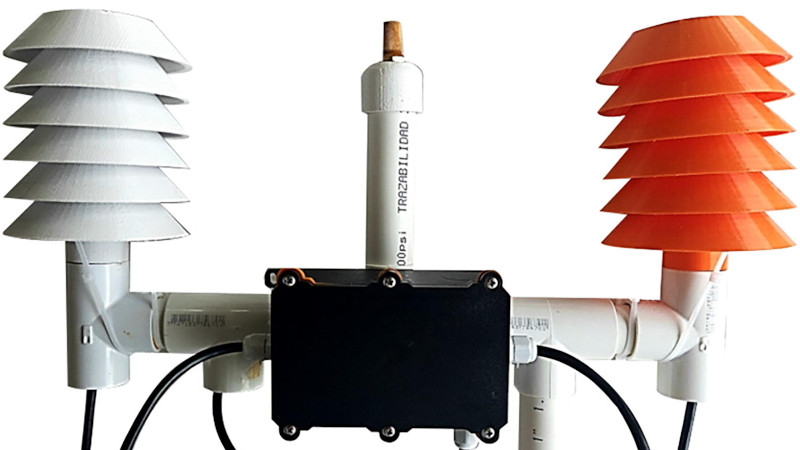
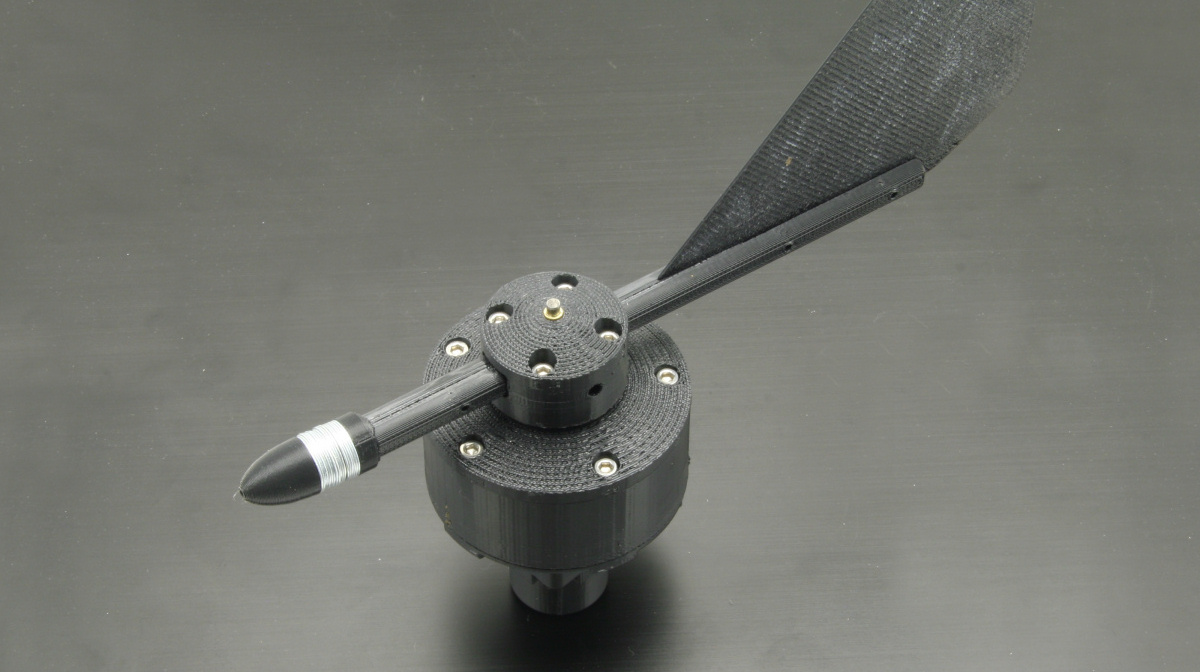
Open Source Ultrasonic Anemometer with no moving parts
Ultrasonic anemometers have no moving parts but come at the cost of significantly more electronic complexity. They work by measuring the time it takes for an ultrasonic audio pulse to be reflected the receiver across a known distance.
Other sensors include an optical rain sensor, light sensor, lighting sensor, and a BME280 for air pressure, humidity, and temperature. [Jianjia] plans to use the QingStation on an autonomous boat, so he also included an IMU, compass, GPS, and a microphone for environmental sounds.
All the hardware and software are open-source and available on GitHub.
See Open Source Ultrasonic Anemometer
#technology #opensource #weatherstation #anemometer #windspeed

Weather stations are a popular project for experimenting with various environmental sensors, and for wind speed and direction the choice is usually a simple cup anemometer and wind vane. For [Jianj…
https://gadgeteer.co.za/open-source-ultrasonic-anemometer-no-moving-parts
One person like that