#magnitude

tpq1980@iviv.hu

Pearson’s #correlation coefficient is the #test that measures the #statistical relationship between two continuous #variables. It is known as the best method of measuring the #association between variables because it is based on the #covariance #method. The PCC gives #information about the #magnitude of the correlation as well as the direction of the #relationship.

If the #coefficient value lies between ±0.50 & ±1, then it is said to be a #strong correlation.

If the #value lies between ±0.30 & ±0.49, then it is said to be a #medium correlation.

If the value #lies below +0.29, then it is said to be a #small correlation.

www.statisticssolutions.com/free-resources/directory-of-statistical-analyses/pearsons-correlation-coefficient

mkwadee@diasp.eu

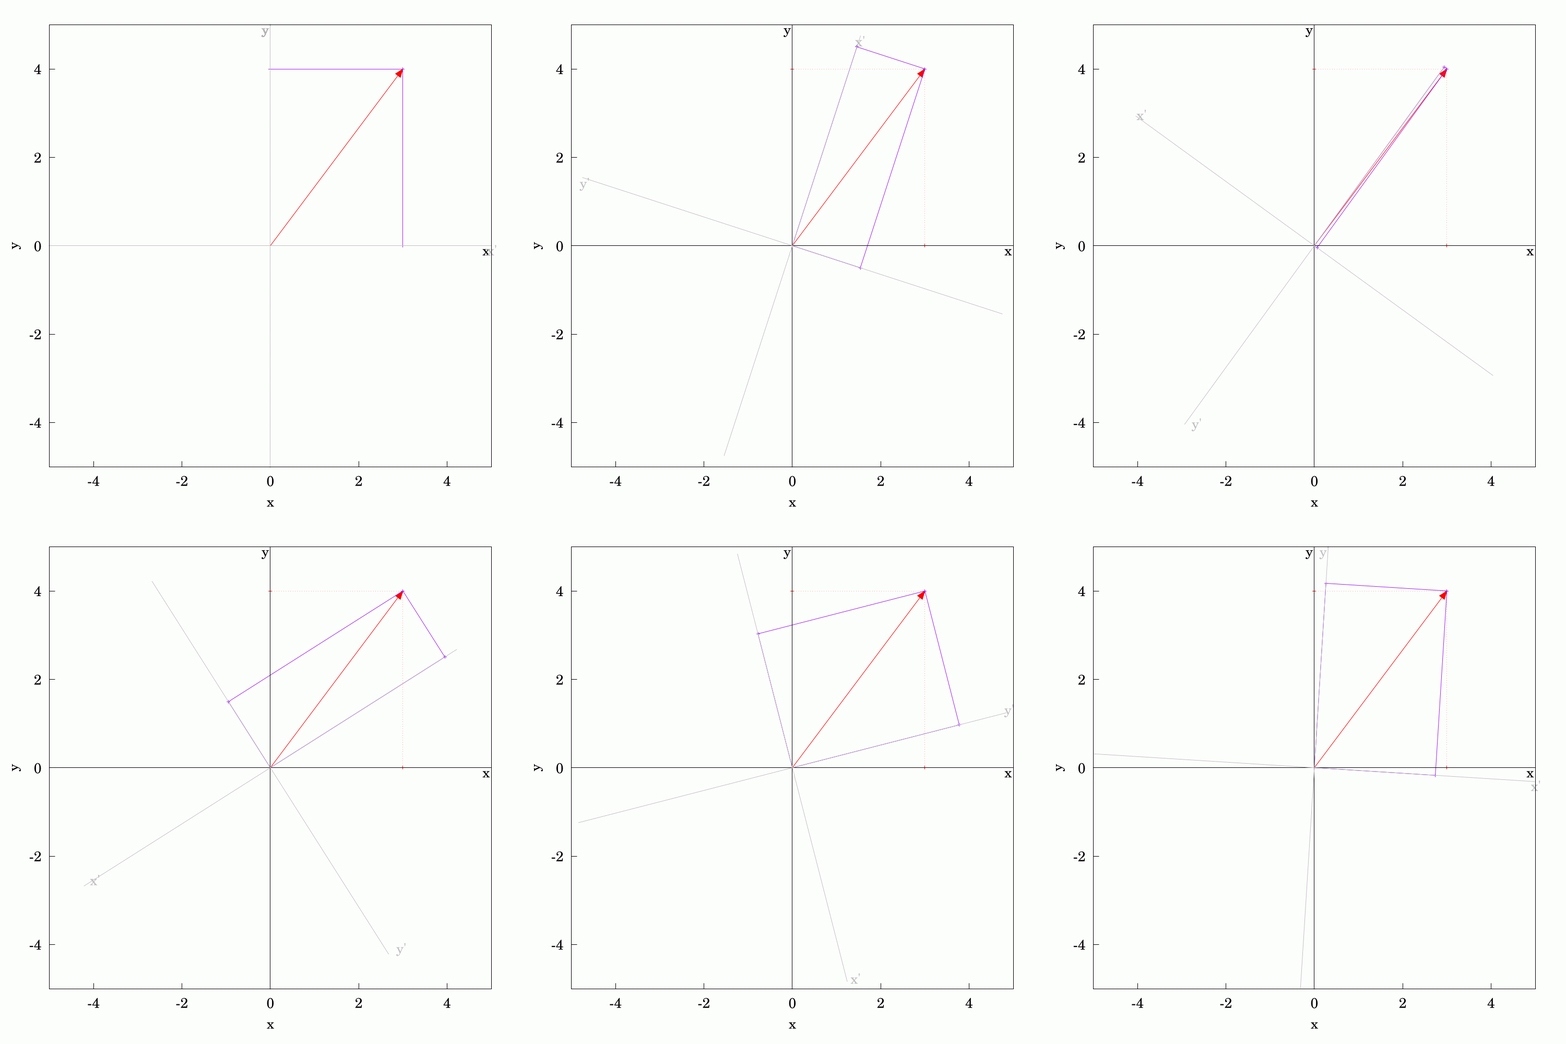
It's straightforward to calculate the #components of a #2D #vector given that you have a pre-defined set of #axes. Often, we talk about #cartesian #coordinates. If the vector changes, whether in #magnitude or #direction, we can calculate the updated components too. The converse question is what if the the vector is held constant and you change or #rotate the axes? The components in the new coordinate system can be found with a little bit of #trigonometry and #algebra. As vectors are #first-order #tensors, they are much simpler to calculate than quantities like stress for which I've also made an animation for if you search for the hashtag #tensors.

In this animation, you can see the components changing as the axes go through a full rotation.

#MyWork #CCBYSA #Mathematics #Mechanics