#coefficient

tpq1980@iviv.hu

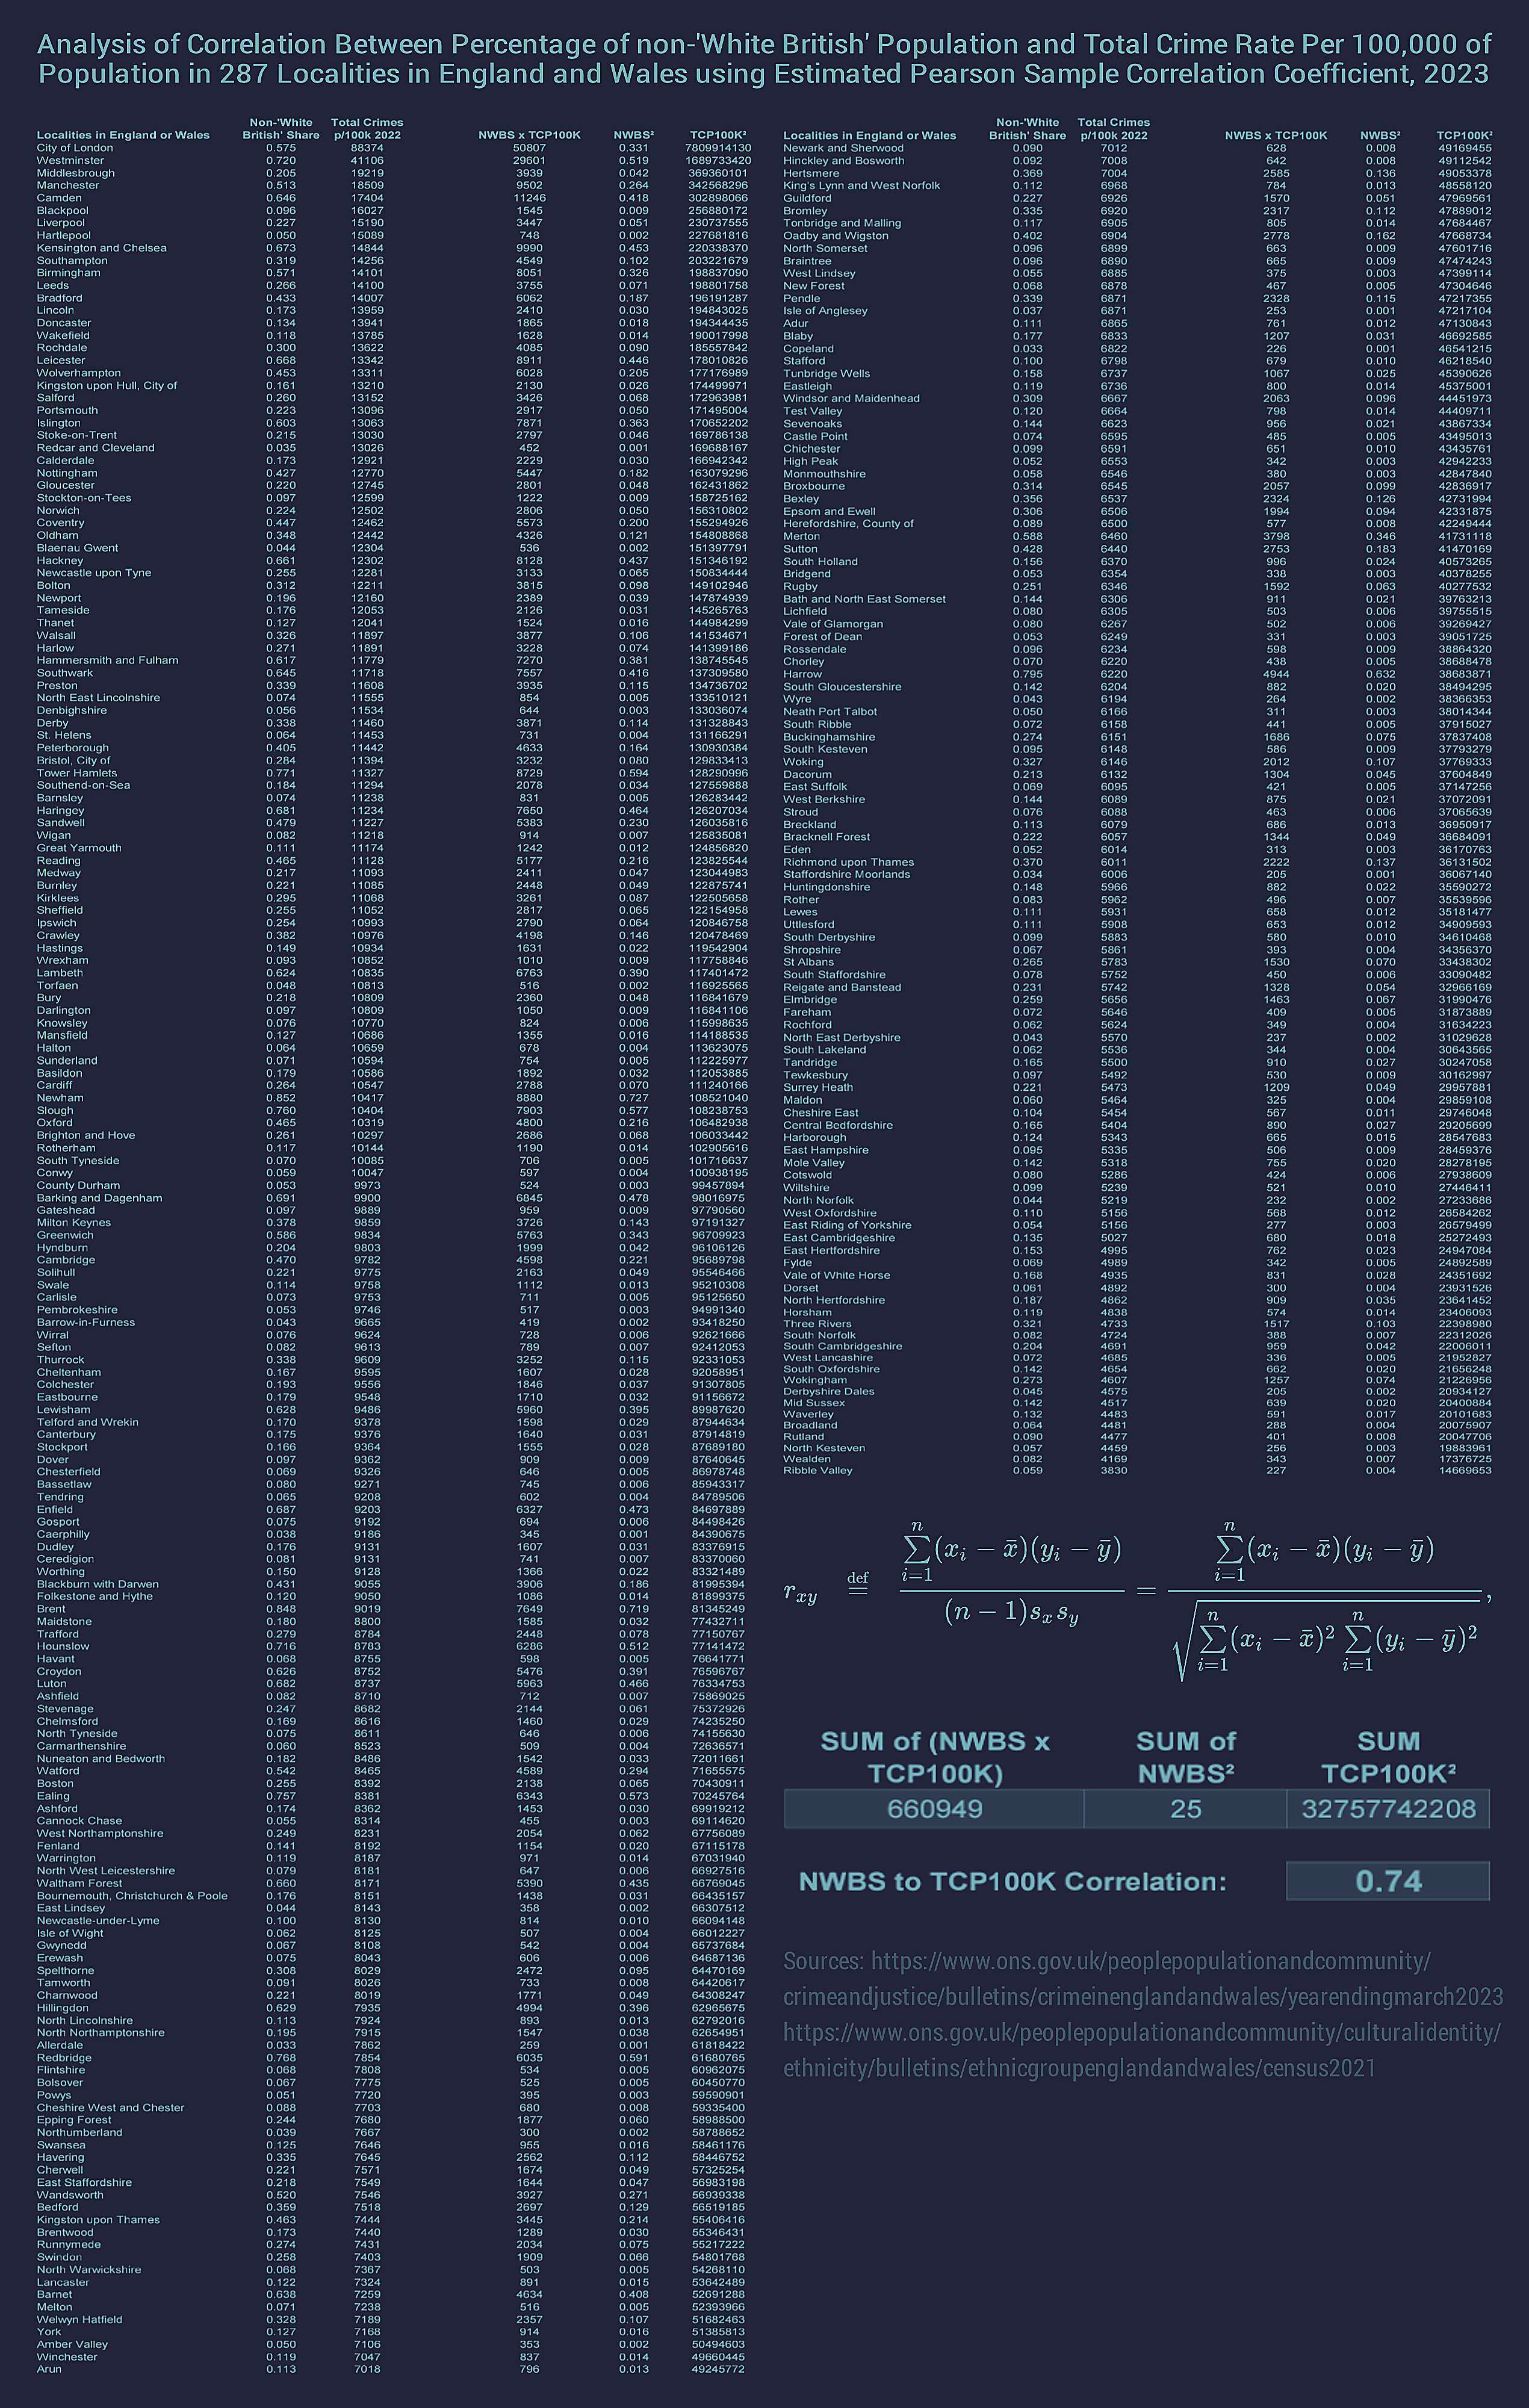
Pearson’s #correlation coefficient is the #test that measures the #statistical relationship between two continuous #variables. It is known as the best method of measuring the #association between variables because it is based on the #covariance #method. The PCC gives #information about the #magnitude of the correlation as well as the direction of the #relationship.

If the #coefficient value lies between ±0.50 & ±1, then it is said to be a #strong correlation.

If the #value lies between ±0.30 & ±0.49, then it is said to be a #medium correlation.

If the value #lies below +0.29, then it is said to be a #small correlation.

www.statisticssolutions.com/free-resources/directory-of-statistical-analyses/pearsons-correlation-coefficient

tpq1980@iviv.hu

#Analysis of #correlation between percentage of non-'White #British#population & total #crime rate per 100,000 of population in 287 localities in #England & #Wales using Estimated Pearson Sample Correlation Coefficient, 2023.

There is a 0.74 (strong) correlation #coefficient between the percentage of non-'#White British' within a population & the total rate of crime per 100,000 of population.

#criminality #ons #whitebritish #migration #multiculturalism #ethnography #diversity #multiracialism #demography #globalism #racism #empiricism #mathematics #data #officeofnationalstatistics #statistics #uk #crimerate #law #justice #policing #usa #propaganda #socialengineering #ethnicity #anthropology #pearsonsamplecorrelation #crimeandethnicity #academicfraud #un #europeans