
One person like that
#demographics
The #British establishment are funding procreative #heterosexuality in #Uganda, a nation with an average birthrate of 4.7 children per couple, but in the #UK, they fund & promote non-procreative LGBTQ+ while the average British #birthrate is disastrously low at 1.56 #children per couple.
This is part of a longterm #plan to reduce the #autochthonous #European #population & then import the #African population when #Africa inevitably collapses due to their population exceeding their #resources & #infrastructure.
#greatreplacement #depopulation #demographics #ethnography #lgb #eugenics #theelite #elites #usa #lgbtq #africa #thewest #fertility
One person like that
"Japan was the future but it's stuck in the past."
"This is the world's third-largest economy. It's a peaceful, prosperous country with the longest life expectancy in the world, the lowest murder rate, little political conflict, a powerful passport, and the sublime Shinkansen, the world's best high-speed rail network."
"America and Europe once feared the Japanese economic juggernaut much the same way they fear China's growing economic might today. But the Japan the world expected never arrived."
But why?
"If you want to see what happens to a country that rejects immigration as a solution to falling fertility, Japan is a good place to start."
"Japan is estimated to have had fewer than 800,000 births last year. In the 1970s, that figure was more than two million."
Population peaked at 128 million in 2017, is 125 million now, is projected to be 53 million by the end of the century.
"Japan now has the world's second-highest proportion of people aged 65 and over -- about 28% -- after the tiny state of Monaco."

3 Likes
7 Comments
1 Shares
6 Likes
11 Comments
2 Shares
"Multiple crises are halting progress on human development, which is going backwards in the overwhelming majority of countries."
"Heading the list of events causing major global disruption are the COVID-19 pandemic and the Russian invasion of Ukraine, which have come on top of sweeping social and economic shifts, dangerous planetary changes, and massive increases in polarization."
"For the first time in the 32 years that the UN Development Programme (UNDP) has been calculating it, the Human Development Index, which measures a nation's health, education, and standard of living, has declined globally for two years in a row."
"This signals a deepening crisis for many regions, and Latin America, the Caribbean, Sub-Saharan Africa, and South Asia have been hit particularly hard."
"Now into its third year, the Covid-19 pandemic is described in the report as 'a window into a new reality', rather than a detour from business as usual."
"The development of effective vaccines is hailed as a monumental achievement, credited with saving around 20 million lives, and a demonstration of the huge power of innovation married to political will. At the same time, the rollout of the vaccines laid bare the huge inequities of the global economy."
"The successive waves of new COVID-19 variants, and warnings that future pandemics are increasingly likely, have helped to compound a generalized atmosphere of uncertainty that was growing in response to the dizzying pace of technological change, its effect on the workplace, and steadily growing fears surrounding the climate crisis."
"Three layers of today's 'uncertainty complex' are identified: dangerous planetary change, the transition to new ways of organizing industrial societies, and the intensification of political and social polarization."
I remember learning in the US, life expectancy has declined every year since 2014, giving at least one piece of objective evidence that life in the US is getting worse, and it's not just a subjective impression. But this isn't about the US -- this is global. Life expectancy, education, and income are the three components of the Human Development Index, which has declined in 90% of countries over the last 2 years.
The report is a 320-page document. I didn't read it but skimmed through the graphs & charts, and some of them are pretty interesting. There's a political polarization chart (p. 9) that shows political polarization is increasing in most countries around the world. I thought political polarization was increasing in the "anglosphere" -- the US (where I am), the UK, Canada, Australia, and New Zealand -- and a few other European countries, e.g. France. But according to this chart, political polarization is occurring in every major region of the world -- not just the aforementioned "Western Europe and North America", but "Eastern Europe and Central Asia", "Asia and the Pacific", "The Middle East and North Africa", and "Latin America and the Caribbean". Most people I talk to in this country seem to think political polarization is happening because the conservative side of society woke up one day and decided to become horrible, morally bad people. But if political polarization is really this pervasive all around the globe, then this can't possibly be the explanation. In 2020 we did a Boulder Future Salon discussion on Peter Turchin's book Age Of Discord, in which he presents a mathematical model of society (based on a set of differential equations) which outputs a "political instability index". But even his model falls short, because it applies to one society at a time and can't explain concurrent increase in political polarization globally. So the explanation for this phenomena remains a mystery.
Negative views about the world are at the highest level in 125 years, according to an analysis of 14 million books (p. 10).
Perceived insecurity has gone up in most countries including "high human development index" countries (p. 11).
Stress levels have gone up for people of all education levels but the less educated people are the more their stress levels have gone up (p. 34).
The effort to transition to renewable energy has increased demand for certain minerals. The greatest increase has happened with lithium, graphite, cobalt, and nickel (p. 42).
Anthropogenic mass now exceeds the world's total living biomass. By "Anthropogenic mass", they mean things like concrete, gravel, bricks, asphalt, metals, and plastic (p. 43).
There's been a dramatic increase in political violence since about 2015. By "political violence" they mean things like violence at protests, riots, battles between opposing groups, and attacks by governments against civilians (p. 88).
Mental disorders such as anxiety and depression have increased in prevalence -- nearly 300 million in 2019. Minority groups are disproportionately affected (p. 94).
People with less education experience more sadness (p. 105).
Frequency of "rationality words" peaked in the 1990 and has been decreasing ever since, in favor of "sentiment-laden language" in both English and Spanish. This applies to both major media, e.g. the New York Times, various book corpora represented in the Google n-gram database (p. 107).
Trust declines with social distance more steeply at lower incomes and higher insecurity. By "social distance", they mean family members (closest), people of other religions, people of other nationalities, and people just being met for the first time (most distant) (p. 141). Greater insecurity is associated with lower personal agency. Greater insecurity is linked to political extremism. Both extreme right and extreme left increase markedly as you go from low insecurity to high insecurity people (p. 142). Insecurity is associated with polarization on preferences over government versus individual responsibility (p. 143).
Ten years ago there were more countries where critical elements for democratic governance were improving than declining -- today, the situation is reversed. Two charts compare 2000-2011 and 2011-2021 (p. 151).
A comparison between "Difference between share of top 10% educated voting left and share of bottom 90% educated voting left" and "Difference between share of top 10% earners voting left and share of bottom 90% earners voting left" shows higher-educated voters significantly increased their voting for left-wing parties (democratic, labour, social democratic, socialist, green, and the like) since the 1960s. A similar increase didn't happen for top-earning people (p. 154).
When people are both highly wealthy and feel highly insecure, their support for political violence increases (p. 155).
Costs for renewable energy have declined dramatically since 2009. Chart shows dramatic decreases for solar photovoltaic (-89%), onshore wind (-70%), and solar thermal (-16%). Only nuclear has increased (+25%) (p. 163).
The Covid-19 pandemic led to an unprecedented decrease in life expectancy and per capita income (p. 167).
Human Development Index declines were not distributed evenly across the globe. They happened the most in the "Latin America and the Caribbean" region (p. 168).
The major theme of the document is "uncertainty". We live in times of rapid technological, economic, political, social, and climate change, and this results in uncertainty. The document has additional sections I haven't commented on much because they didn't have a lot of graphs & charts. For example there is a lot in the document on climate change, financial risk and how financial uncertainty affects people cognitively, and gender social norms. In the climate section for example you can read all about how such things as drought, physiological heat stress, fire risk, coastal flooding and flooding at river confluences, and wind and precipitation extremes affect the Human Development Index.
Human development falling behind in ninety per cent of countries: UN report

5 Likes
8 Comments
2 Shares
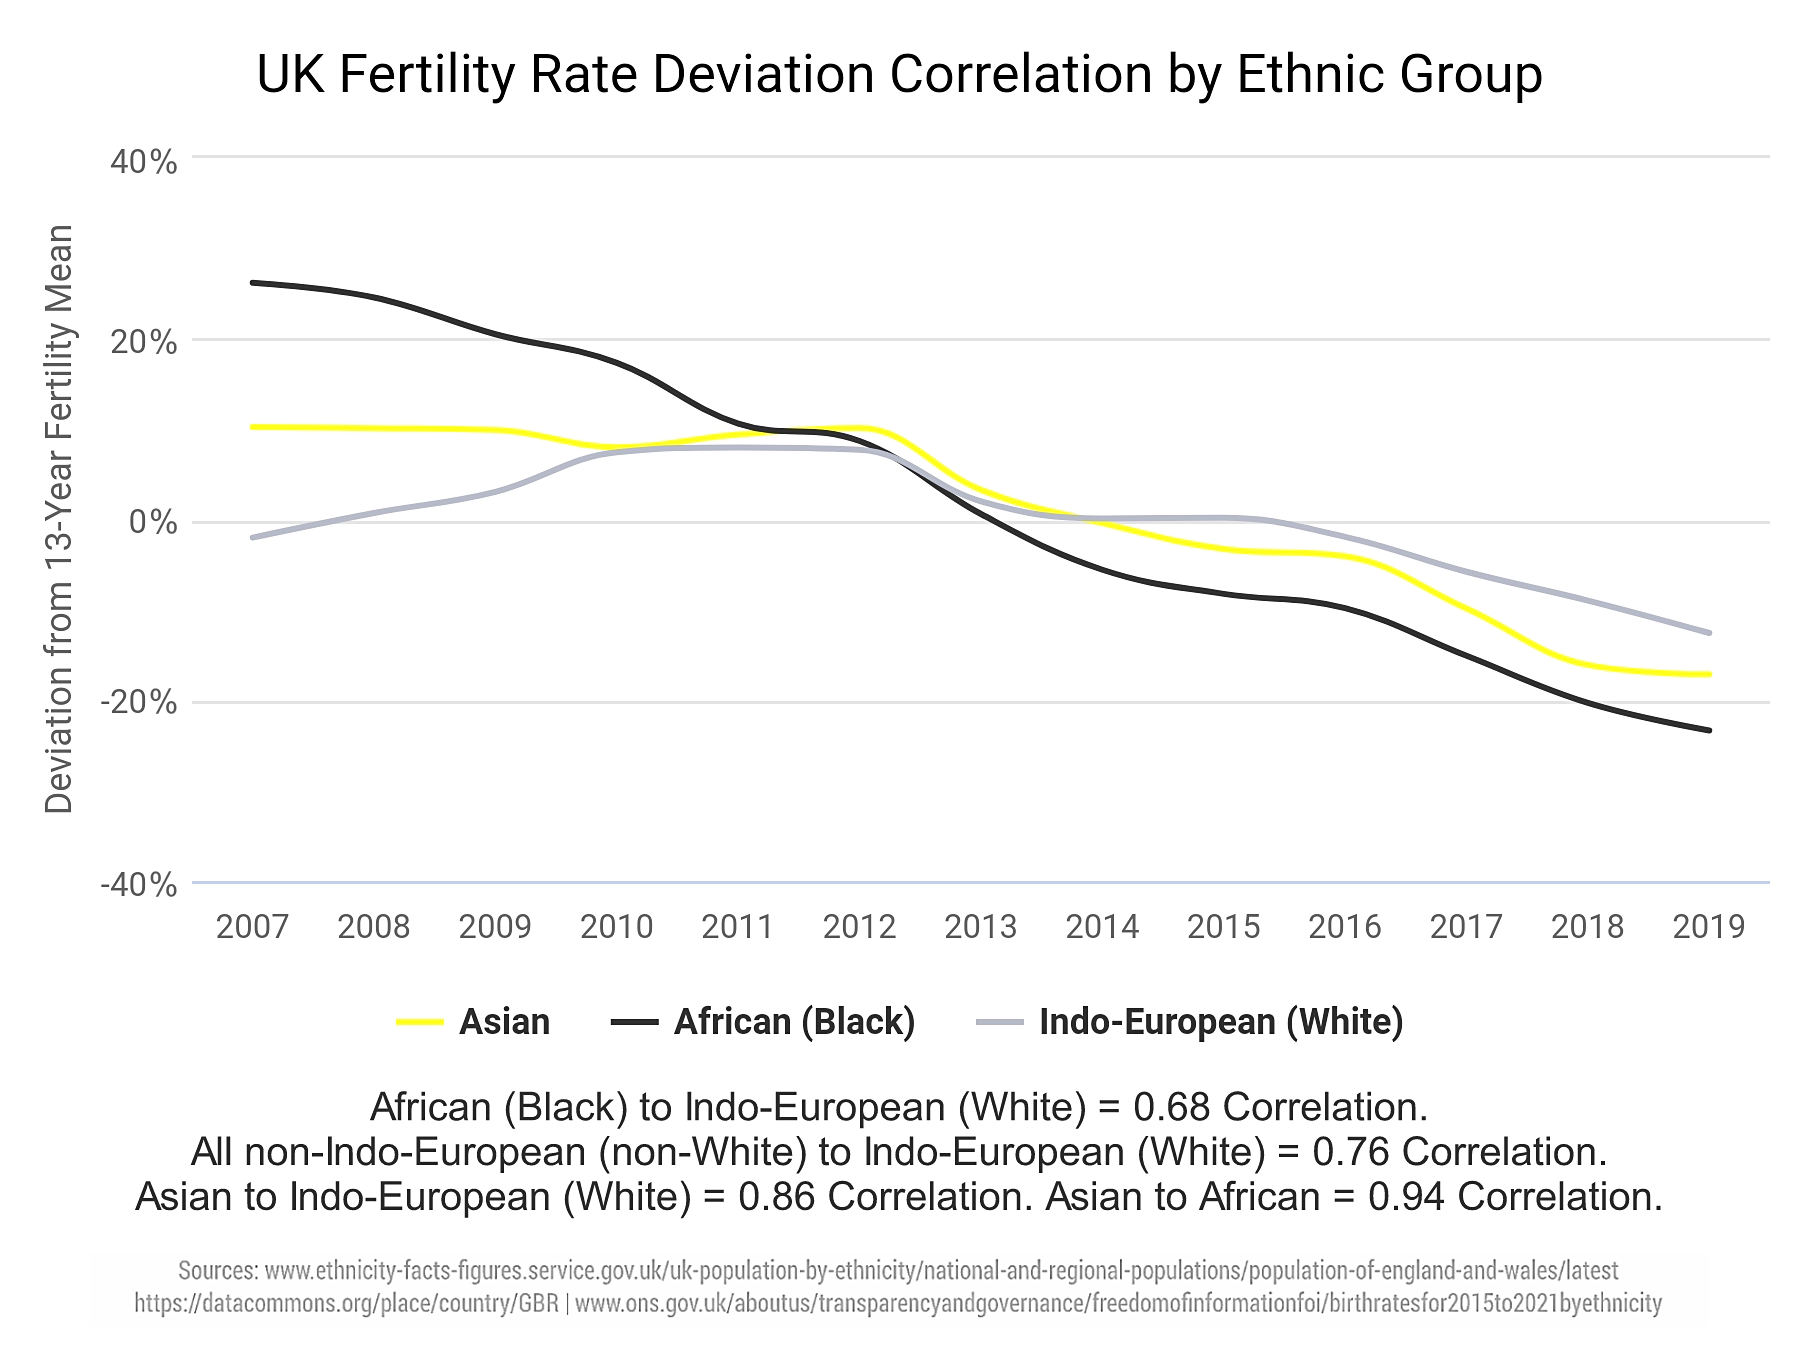
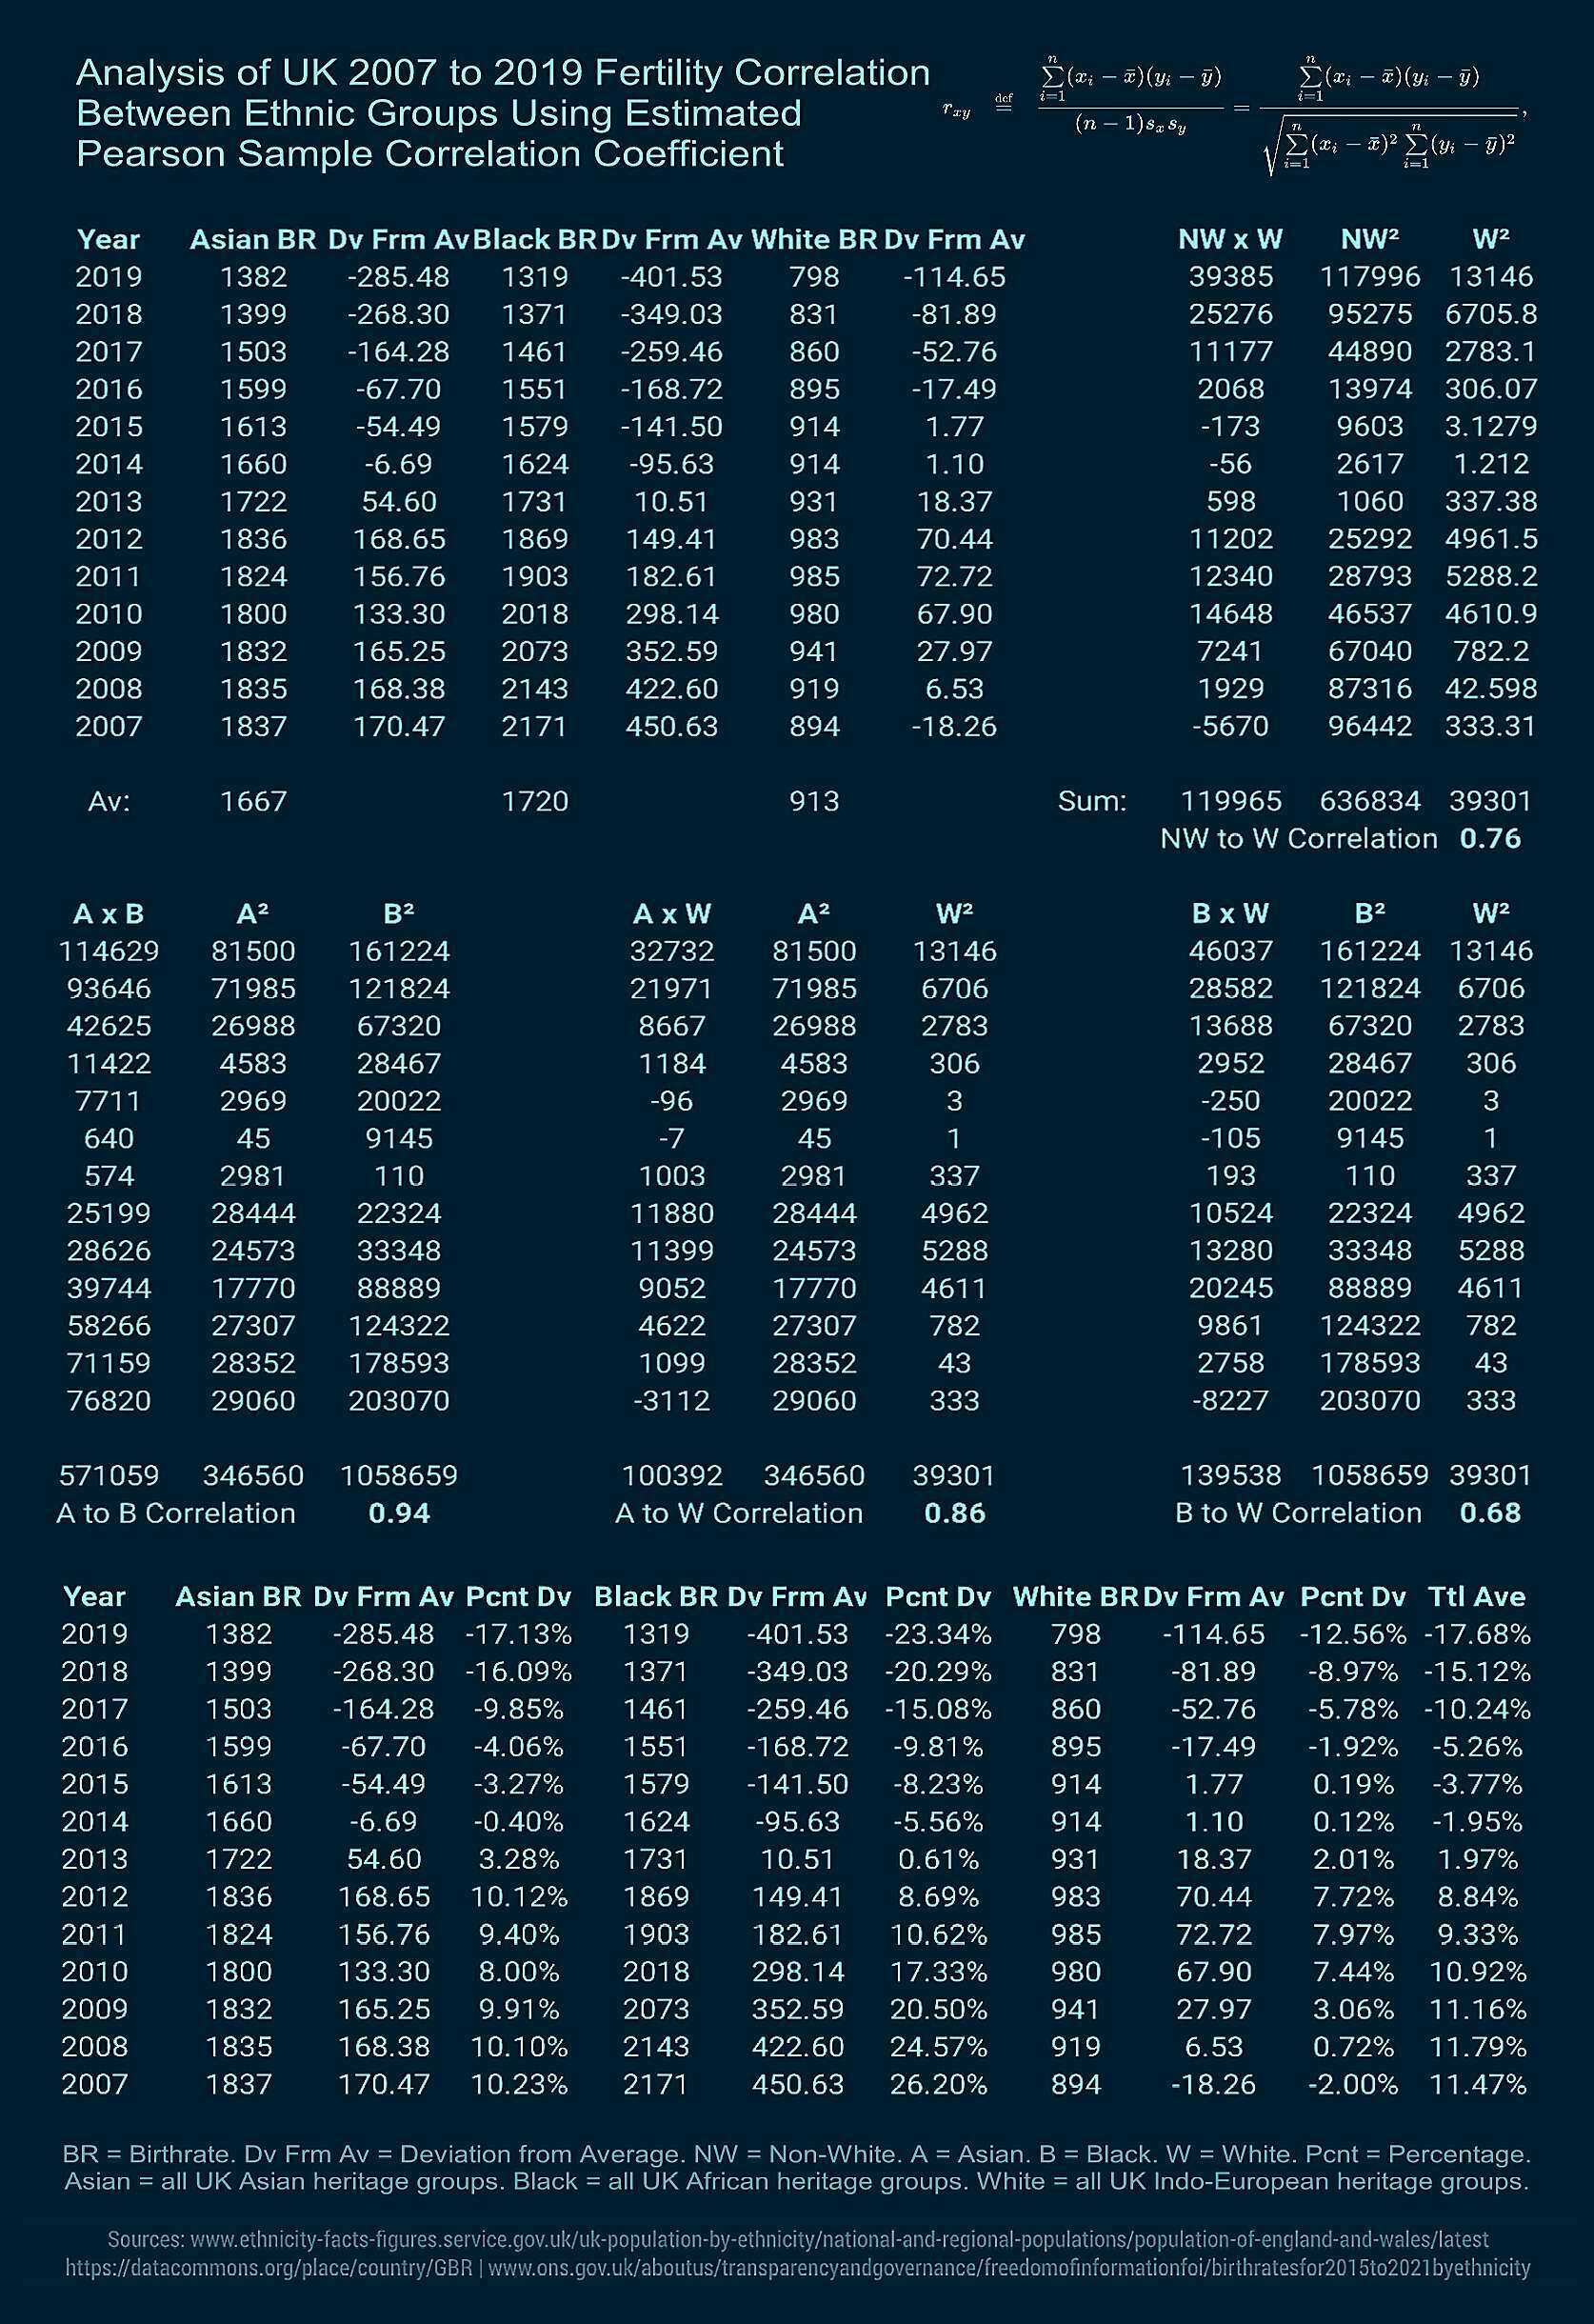
Analysis of UK 2007 to 2019 fertility #correlation between ethnic groups.
Something happens around 2012 that negatively influences all group's fertility, some more than others.
The fact that each ethnic group's fertility rate change is so very highly correlated despite significant differences in geographic distribution suggests to me an external, society-wide influence.
#uk #britain #ukpopulation #ethnicity #demographics #ukdemographics #socialengineering #ethnography #ukethnography #england #white #black #asian #indoeuropean #data #african #multiculturalism #chemical #endocrinedisruptors #analysis #usa #graphs #charts #mathematics #eu #statistics #stats #ukgovernment #britishgovernment #fertilityrates #multiracialism #demography #gb #ethnicgroups #populationdata
One person like that
6 Comments
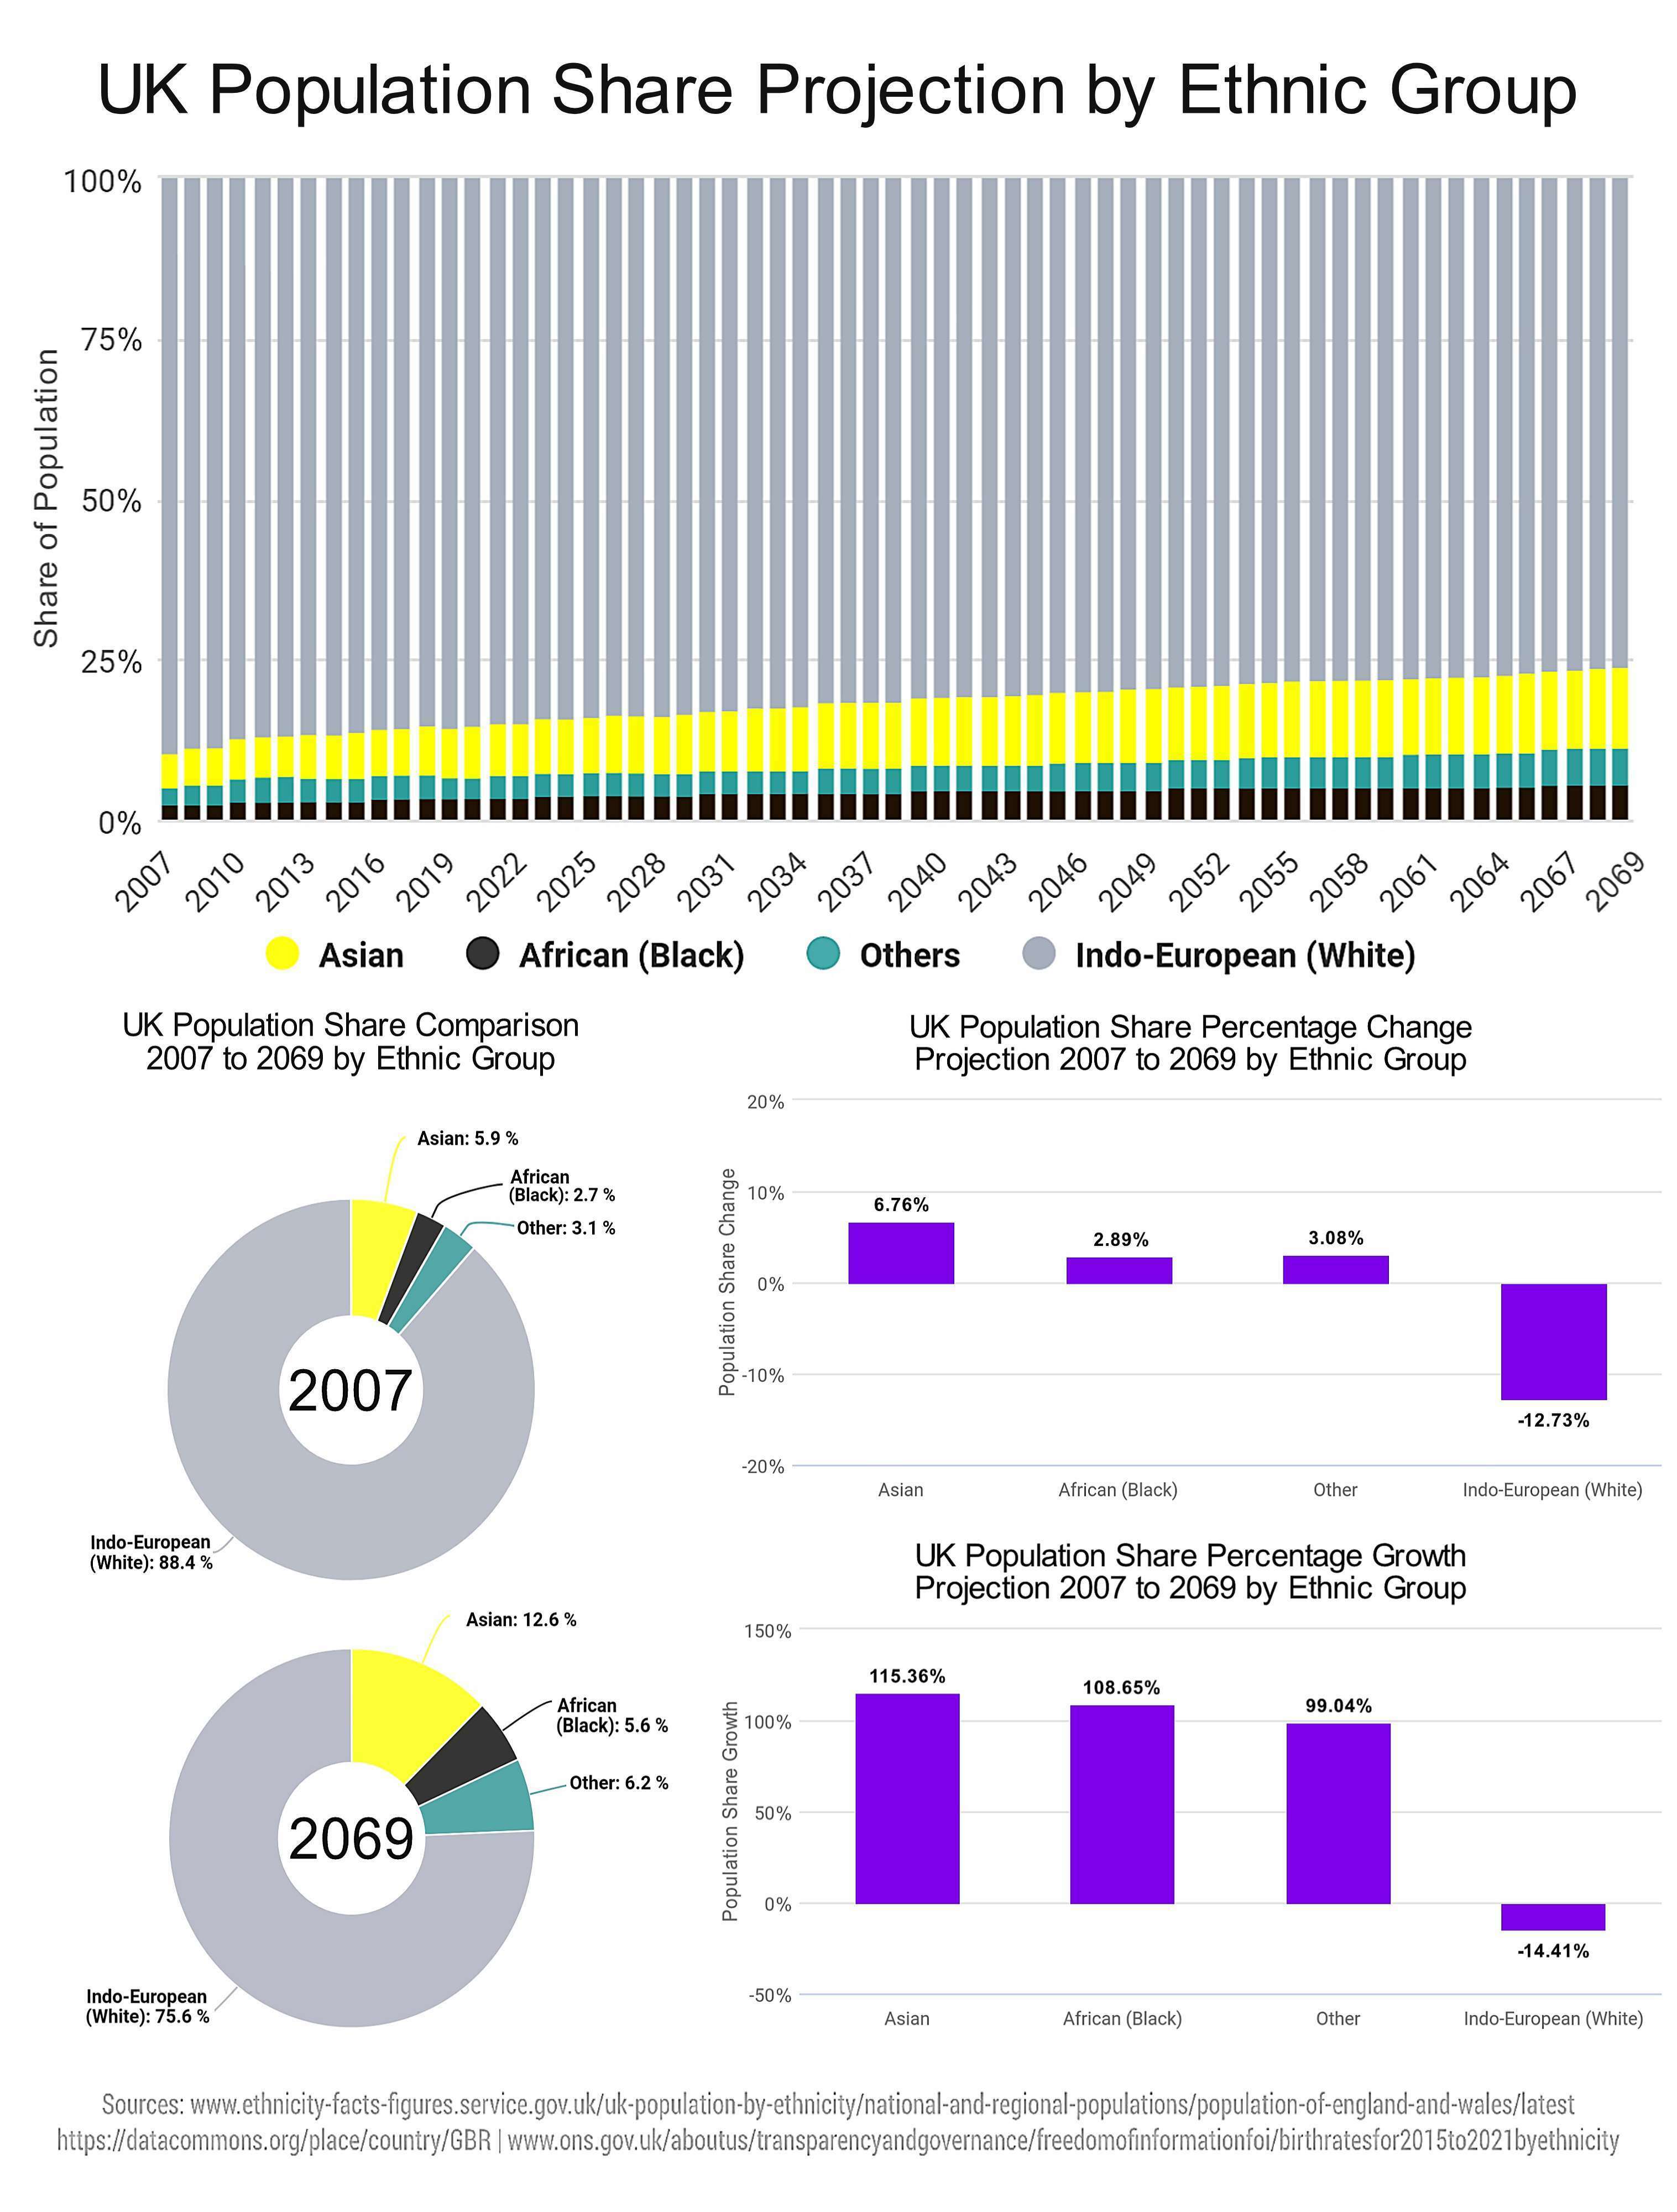
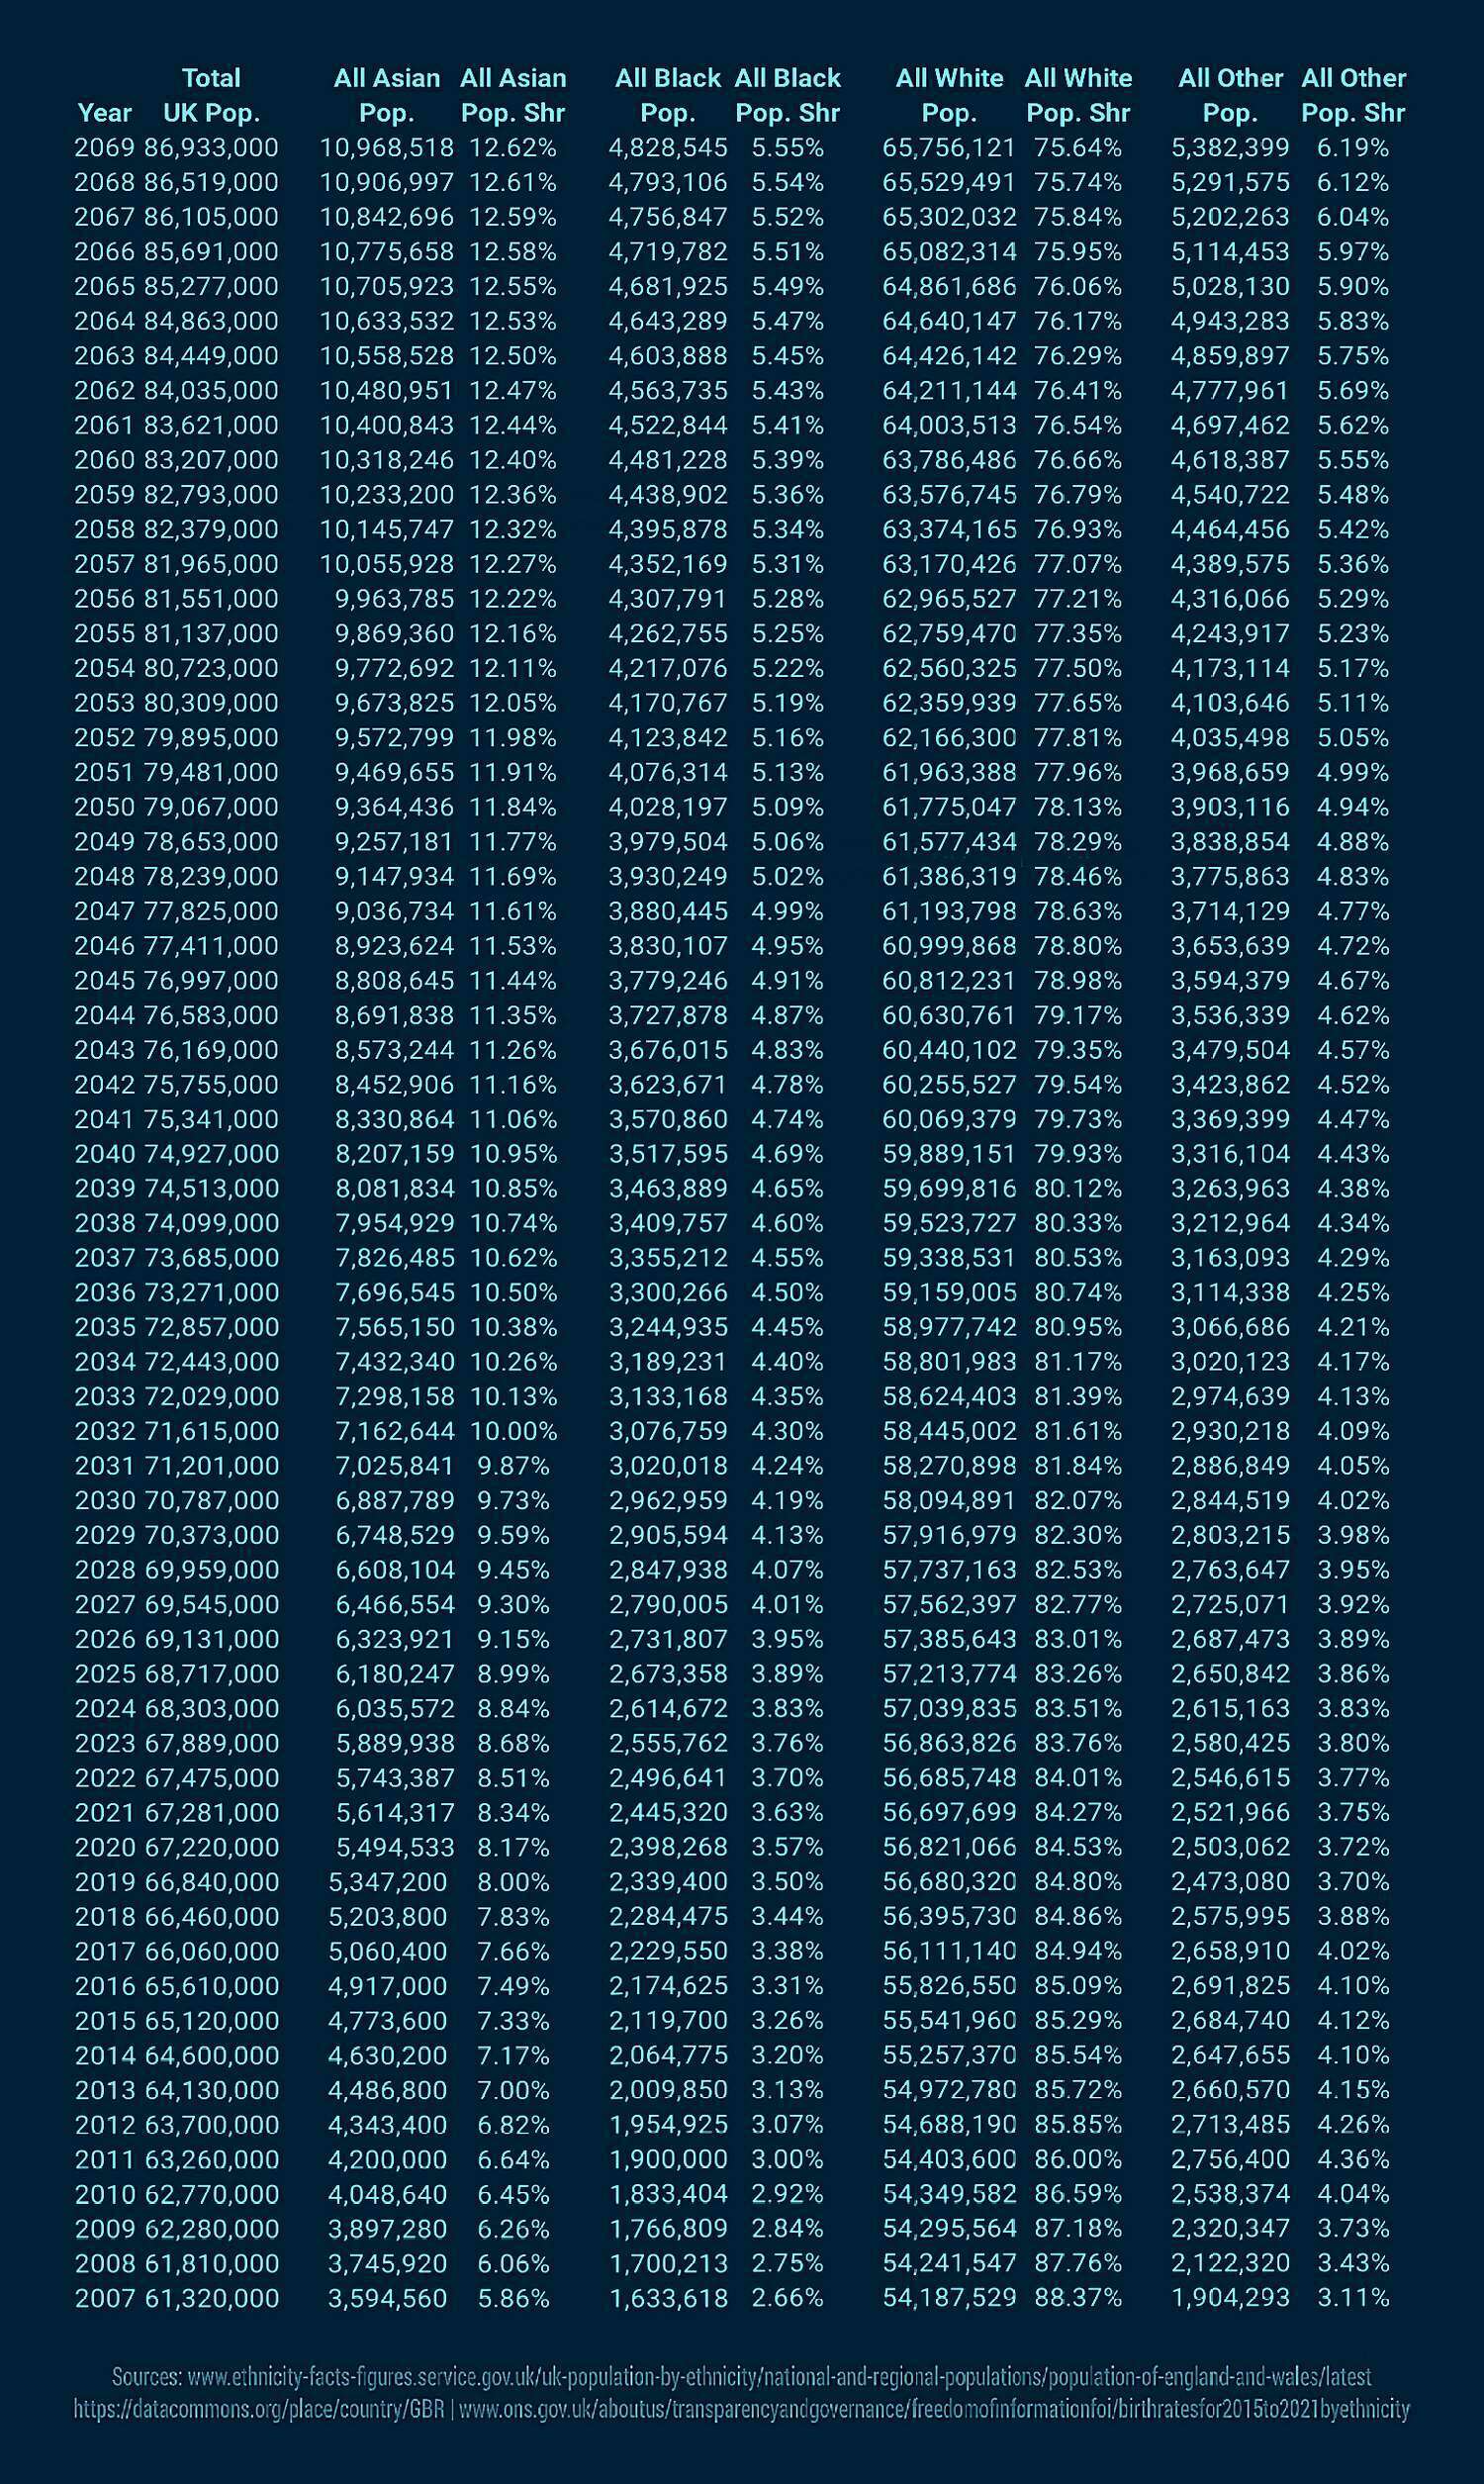
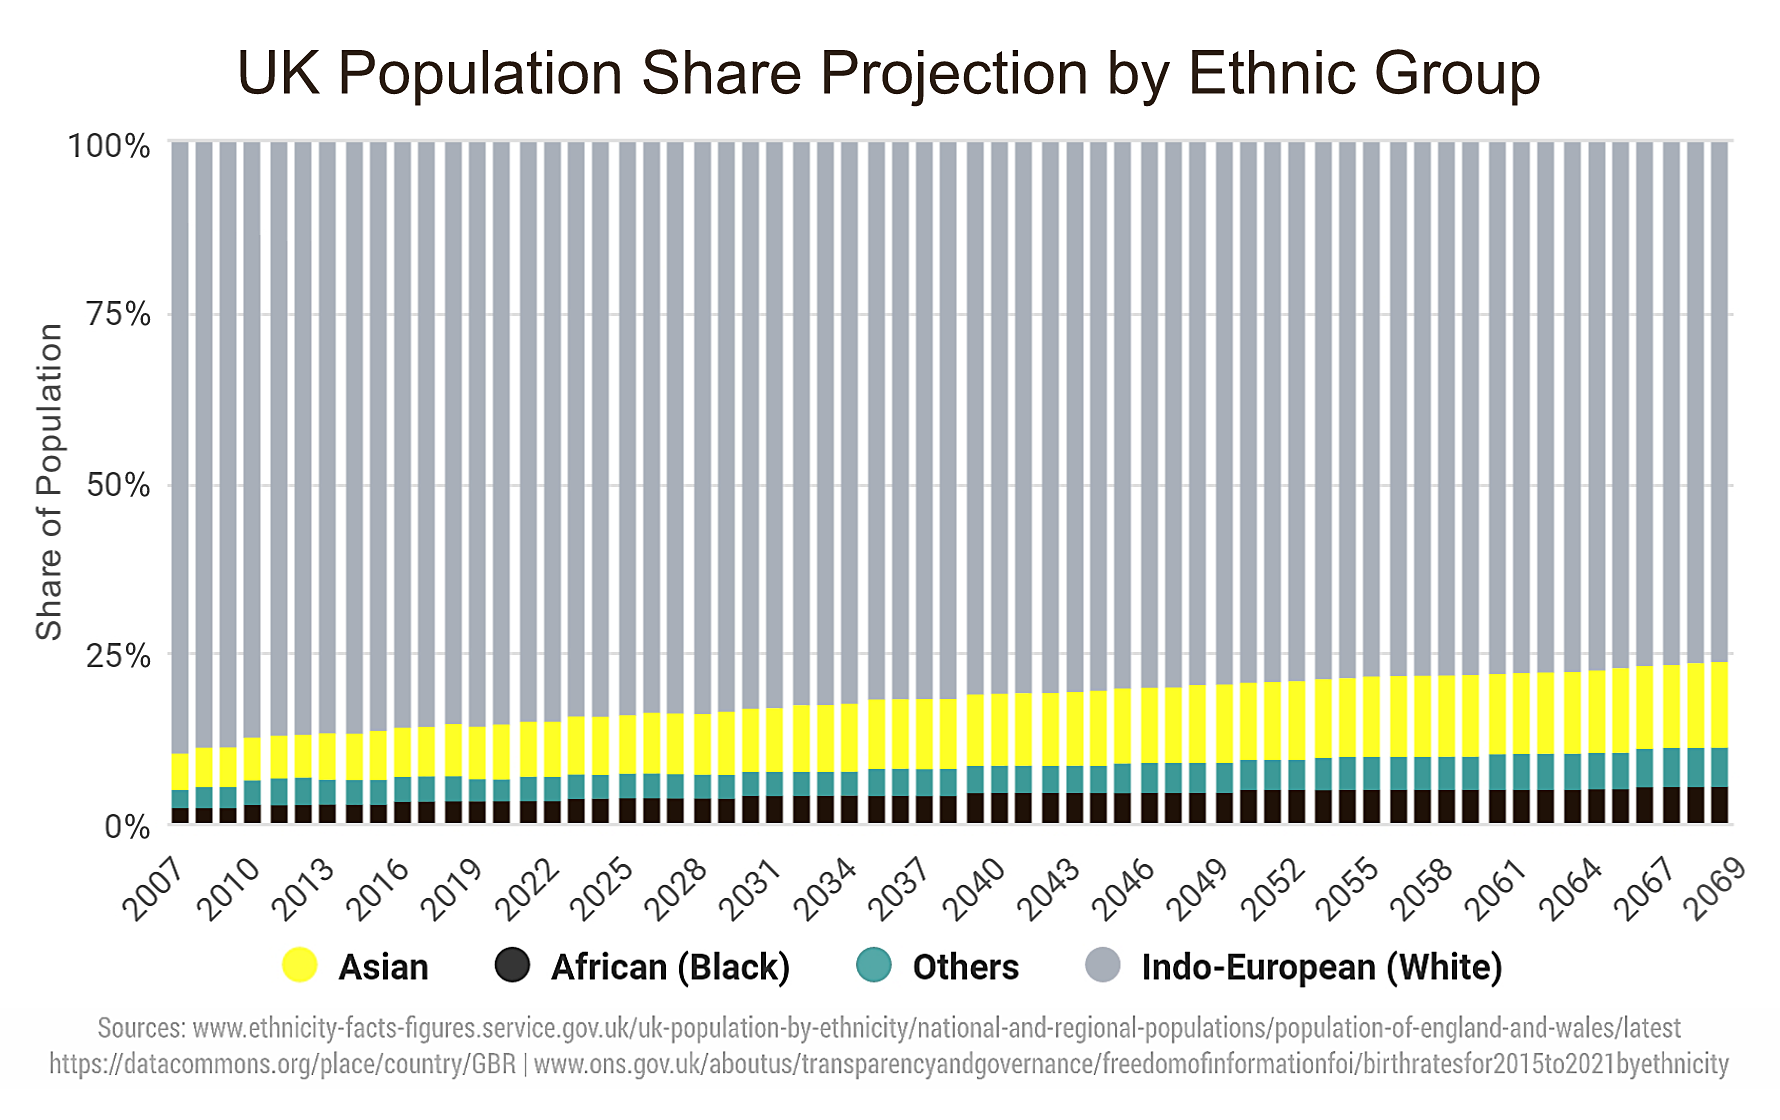
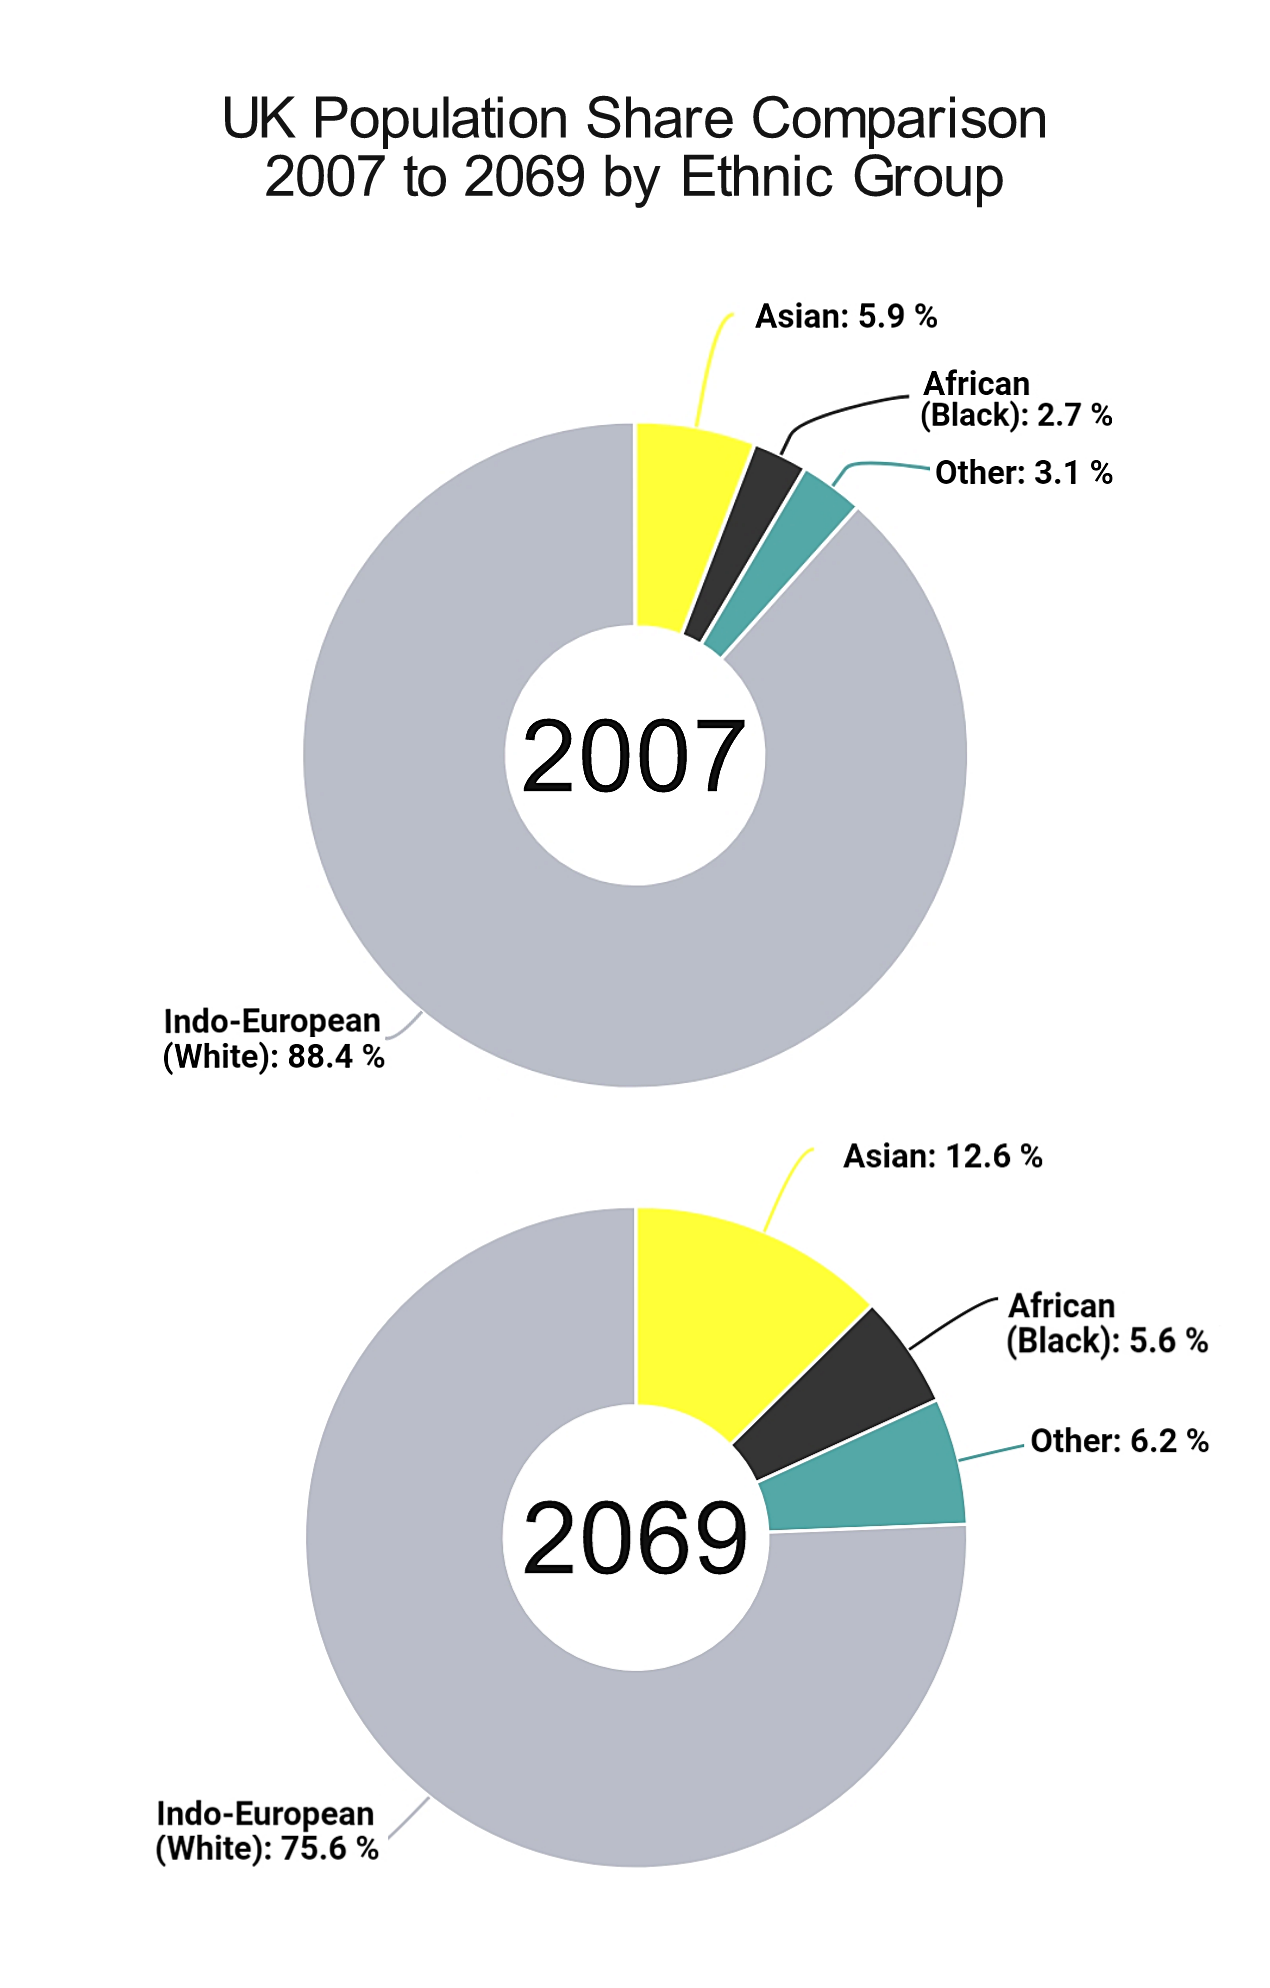
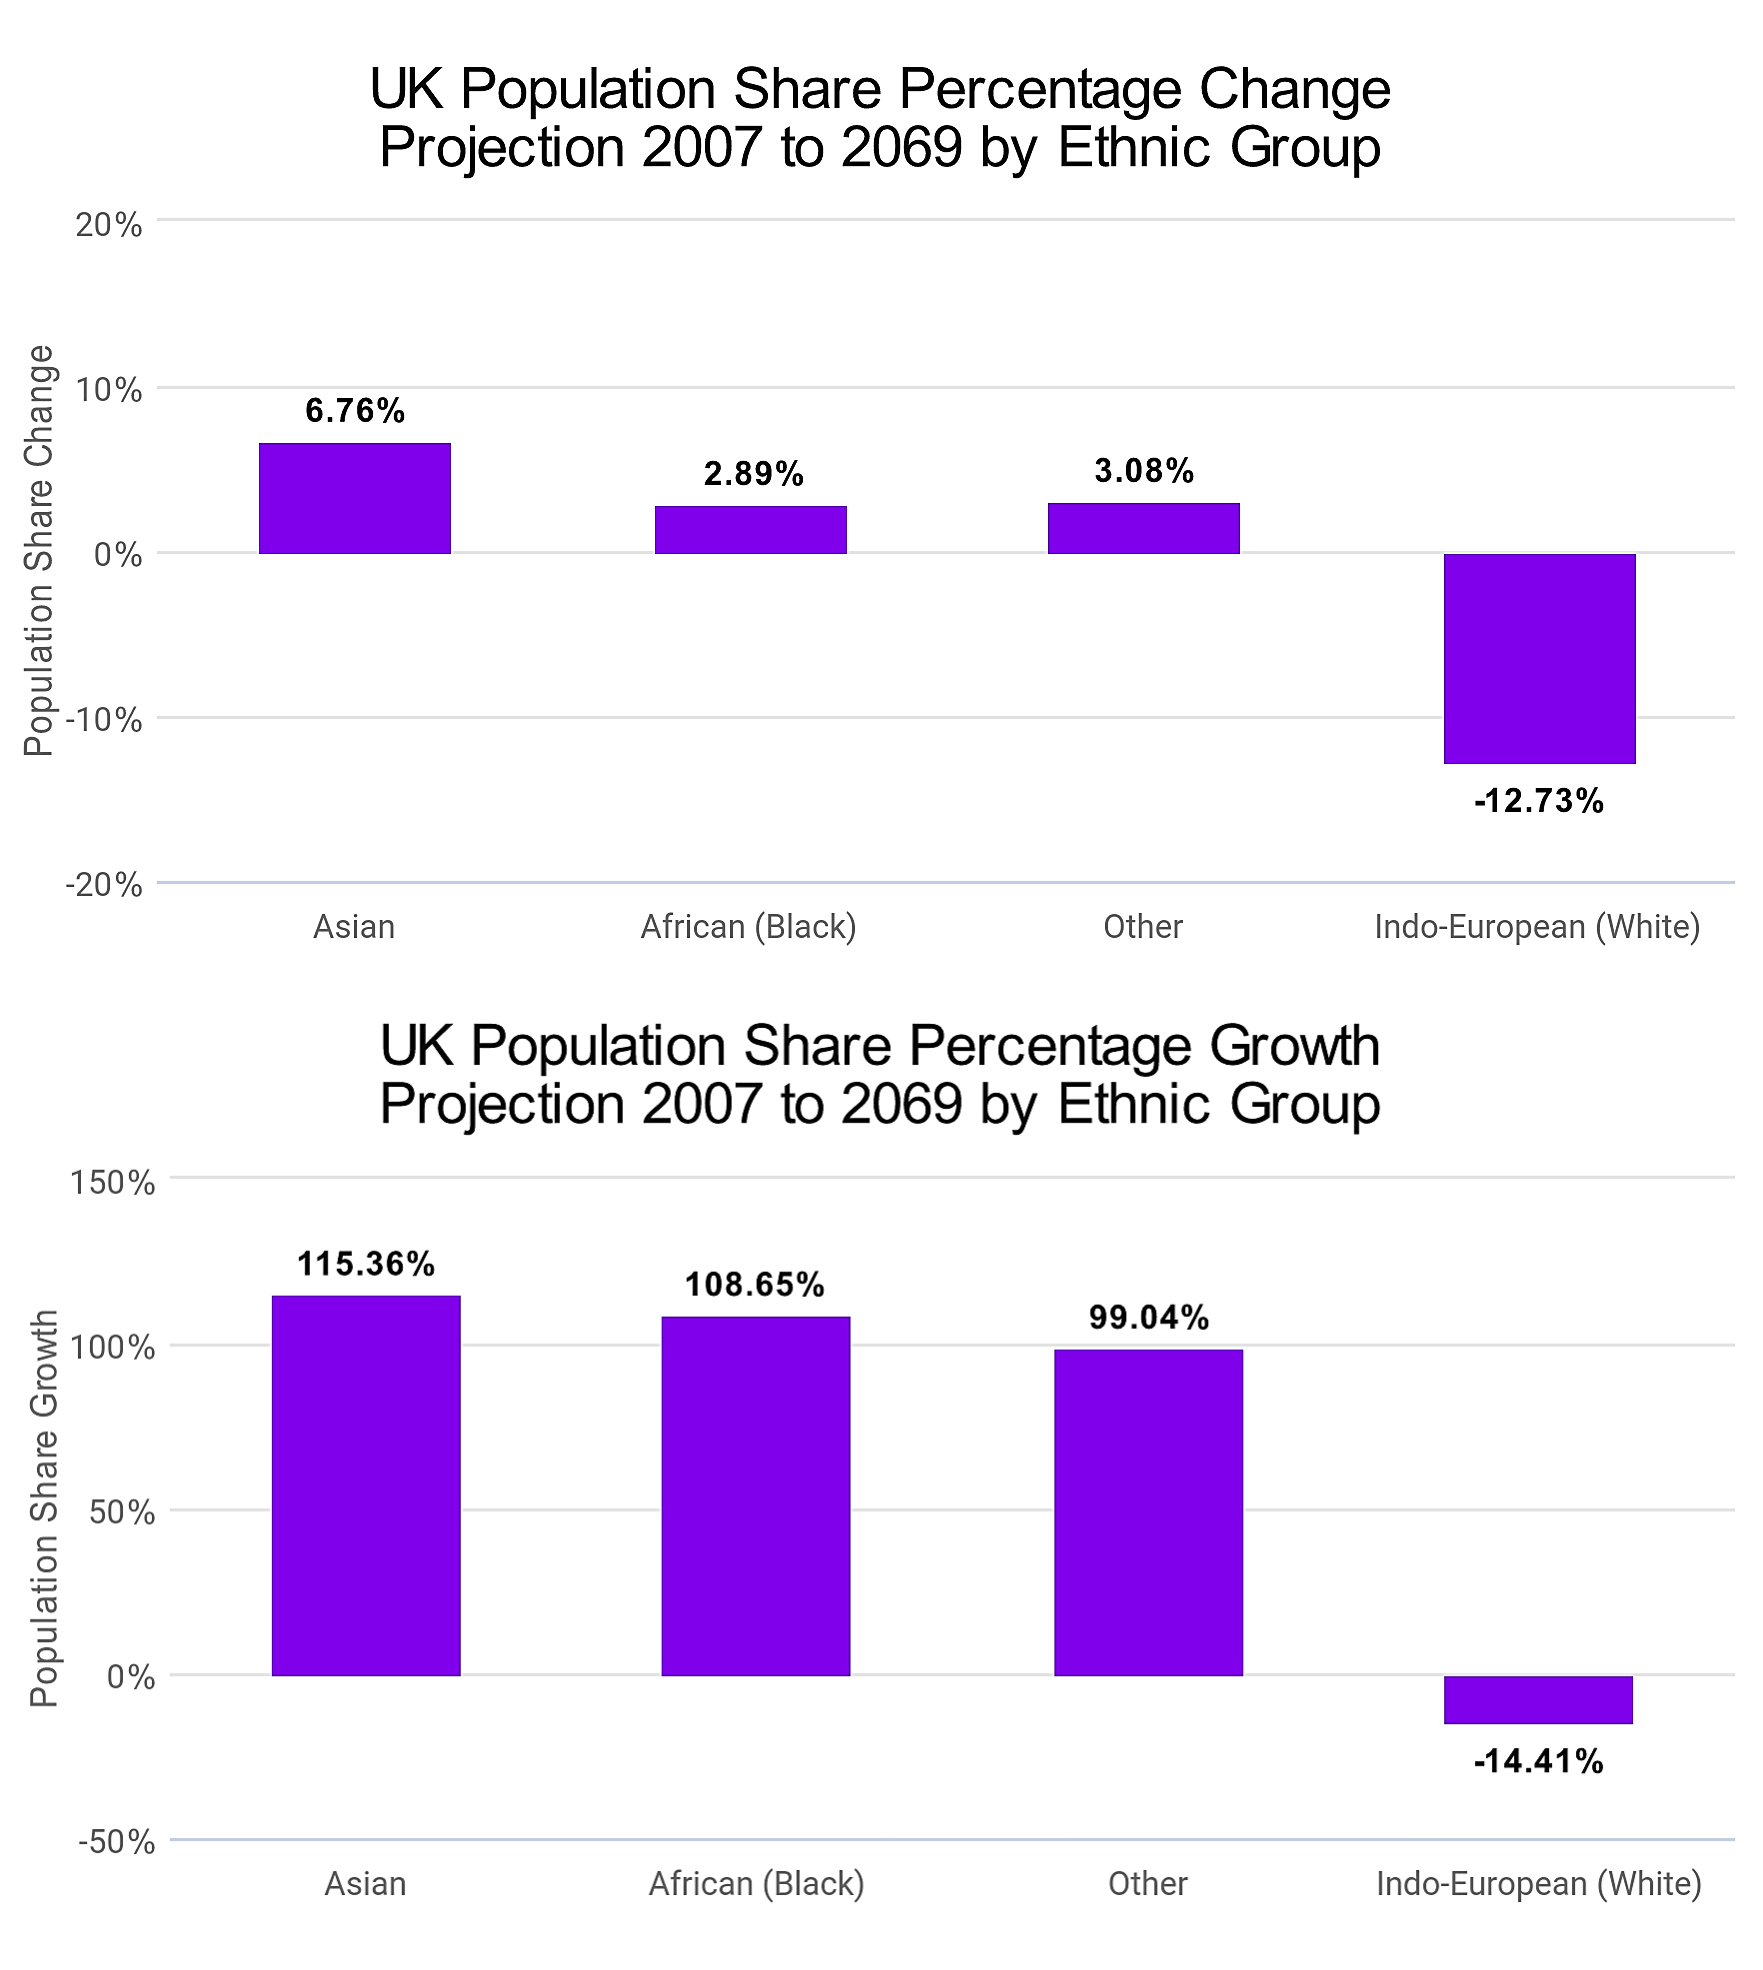
#UK population share by #ethnicity 2007 to 2069, using UK government fertility & #population data 2007 to 2019 & projected to 2069 using linear #growth modified by #population growth #trends derived from the 2007 to 2019 #data.
When did the #British people #vote for demographic change? When was the #referendum? Which party ran on a platform of demographic change & was subsequently #elected to office?
#britain #ukpopulation #info #demographics #ukdemographics #ukethniccomposition #ethnography #ukethnography #england #white #black #asian #indoeuropean #african #multiculturalism #birthrates #demographicchange #analysis #graphs #charts #mathematics #statistics #stats #ukgovernment #britishgovernment #immigration #multiracialism #demography #ethnicgroups #populationdata
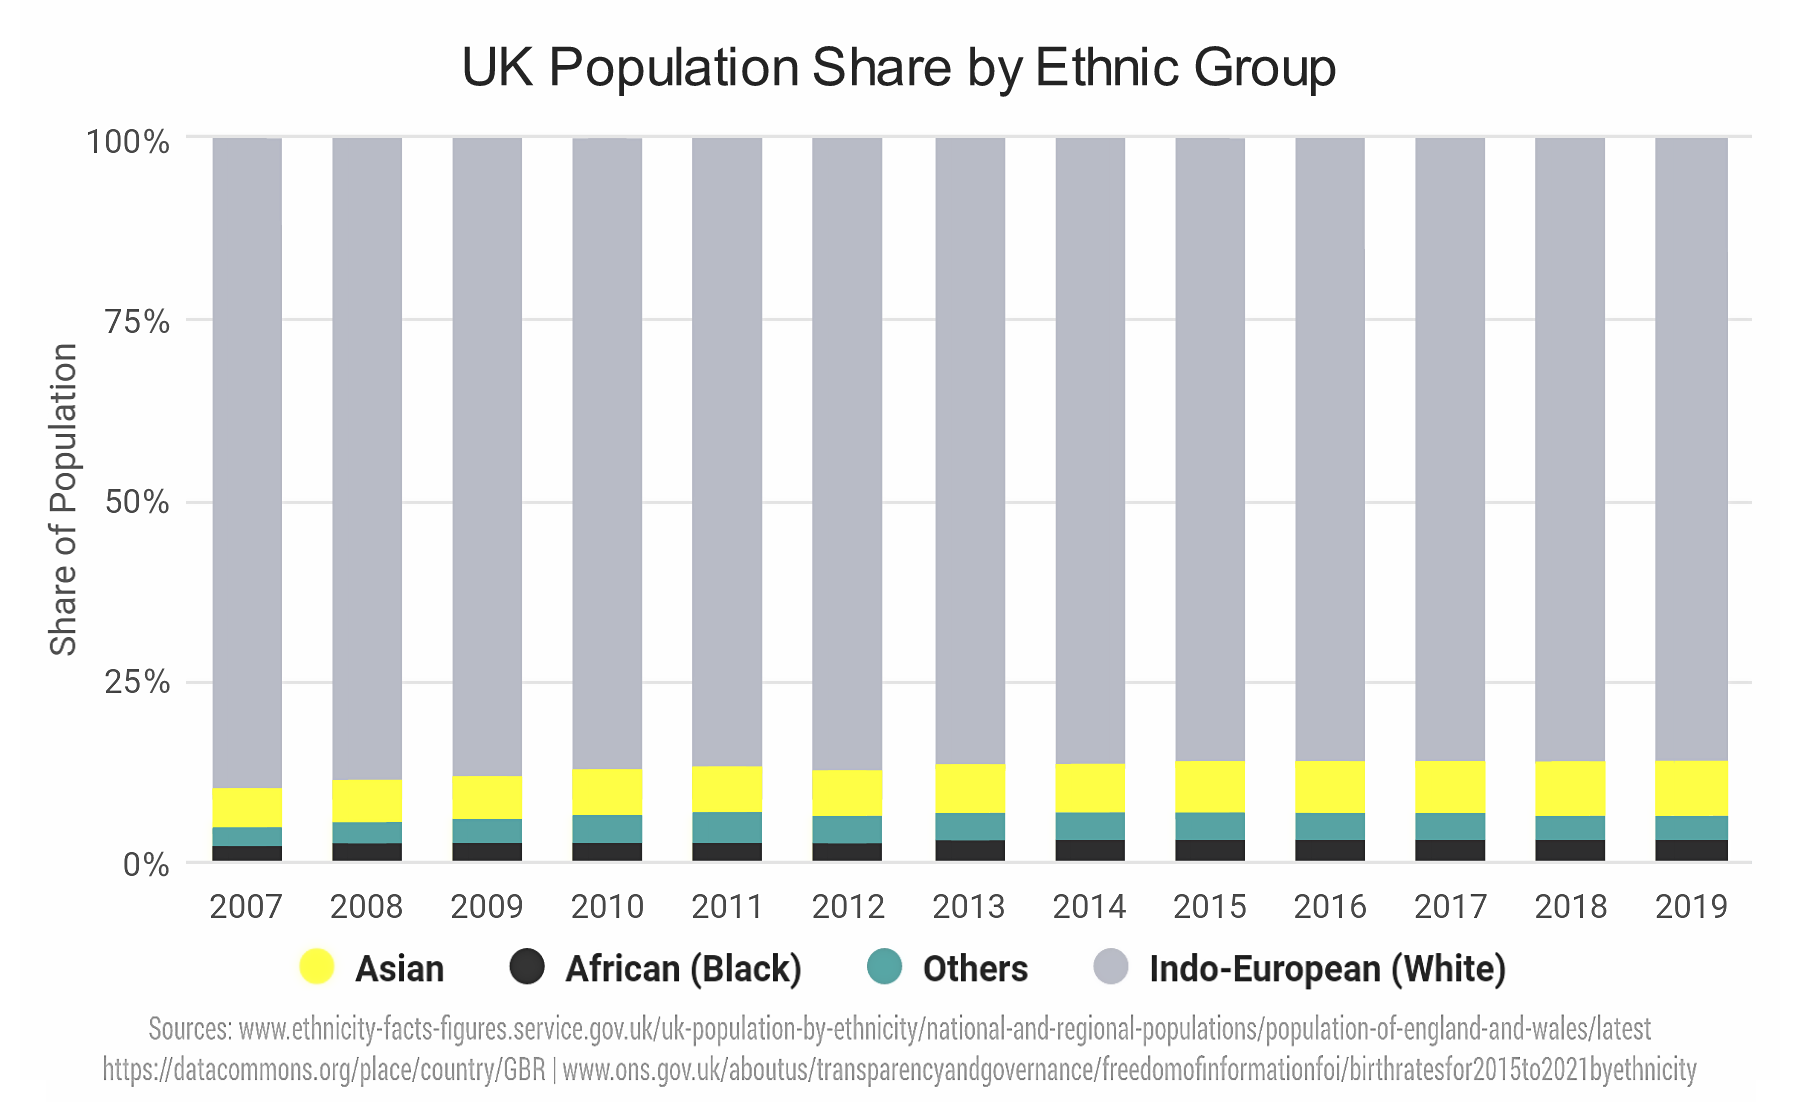
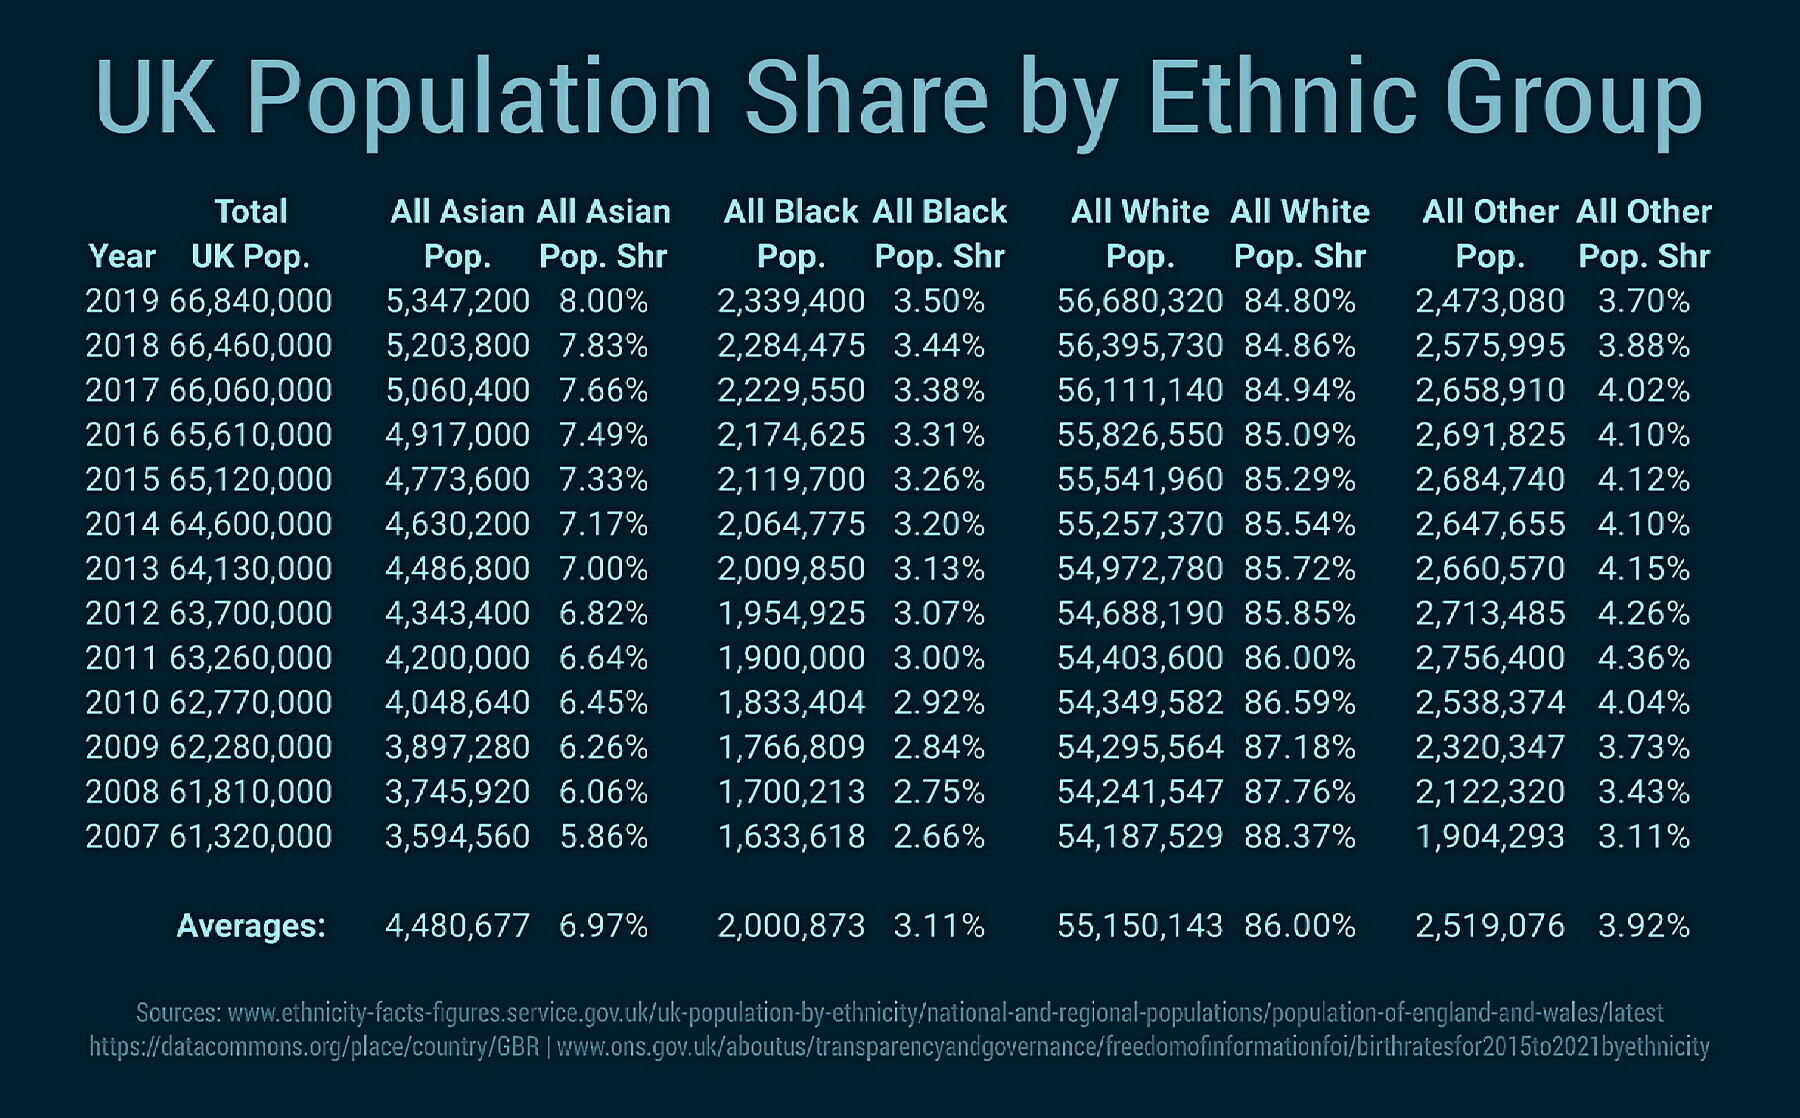
UK Population by Ethnic Group from 2007 to 2019 based on official British government data.
#uk #britain #ukpopulation #ethnicity #demographics #ukdemographics #ukethniccomposition #ethnography #ukethnography #england #white #black #asian #indoeuropean #data #african #multiculturalism #birthrates #demographicchange #analysis #usa #graphs #charts #mathematics #eu #statistics #stats #ukgovernment #britishgovernment #immigration #multiracialism #demography #gb #ethnicgroups #populationdata
2 Likes
Scott Alexander Siskind, aka "Astral Codex Ten guy", weighs in on underpopulation concerns.
"1: Declining birth rates won't drive humans extinct, come on." "Not only are we not going to go extinct because of underpopulation, population is going to continue to rise for the next 80 years."
"2: Immigrant-friendly countries will keep growing." US will go from 330 million to 430 million in 2100. UK will go from 60 million to 80 million.
"3: Countries with low immigration will shrink, but mostly slowly." Brazil 210 million to 190 million in 2100. Germany 80 million to 70 million. Japan 125 million to 70 million. India 1.3 billion to a peak of 1.8 billion in 2060, then down to 1.6 billion in 2100. China 1.4 billion to 800 million in 2100.
"4: Big relative drops still imply high absolute populations." "But Japan and China will drop a lot. By 2100, there will only be 800 million Chinese and 70 million Japanese."
"5: Concerns about 'underpopulation' make more sense as being about demographic shift." "In high-immigration countries, declining birth rates will cause changing ethnic demographics, as native populations shrink and immigrant populations increase."
"6. Age pyramid concerns are real, but not compatible with technological unemployment concerns." "It's weird to be worried both that the future will be racked by labor shortages, and that we'll suffer from technological unemployment and need to worry about universal basic income."
"7: Dysgenics is real but pretty slow." "Another potential demographic shift in both types of country is shift among social classes / levels of educational attainment."
"8. Innovation concerns are real but probably overwhelmed by other factors." "Consider the century 1820-1920. It gave us the steamship, the railroad, the automobile, the factory, mass production, electricity, refrigeration, radio, the airplane, etc, etc, etc, with a population only about 10-20% as high as today."
"9. In the short-to-medium run, we're all dead." Alrighty then. Wait, one more...
"Appendix: The Amish inversion." "Suppose that there is a 2100 -- and even a 2200, 2300, etc. what happens if we extend current trends? Answer: the Amish take over the world."
5 Likes
3 Comments
1 Shares
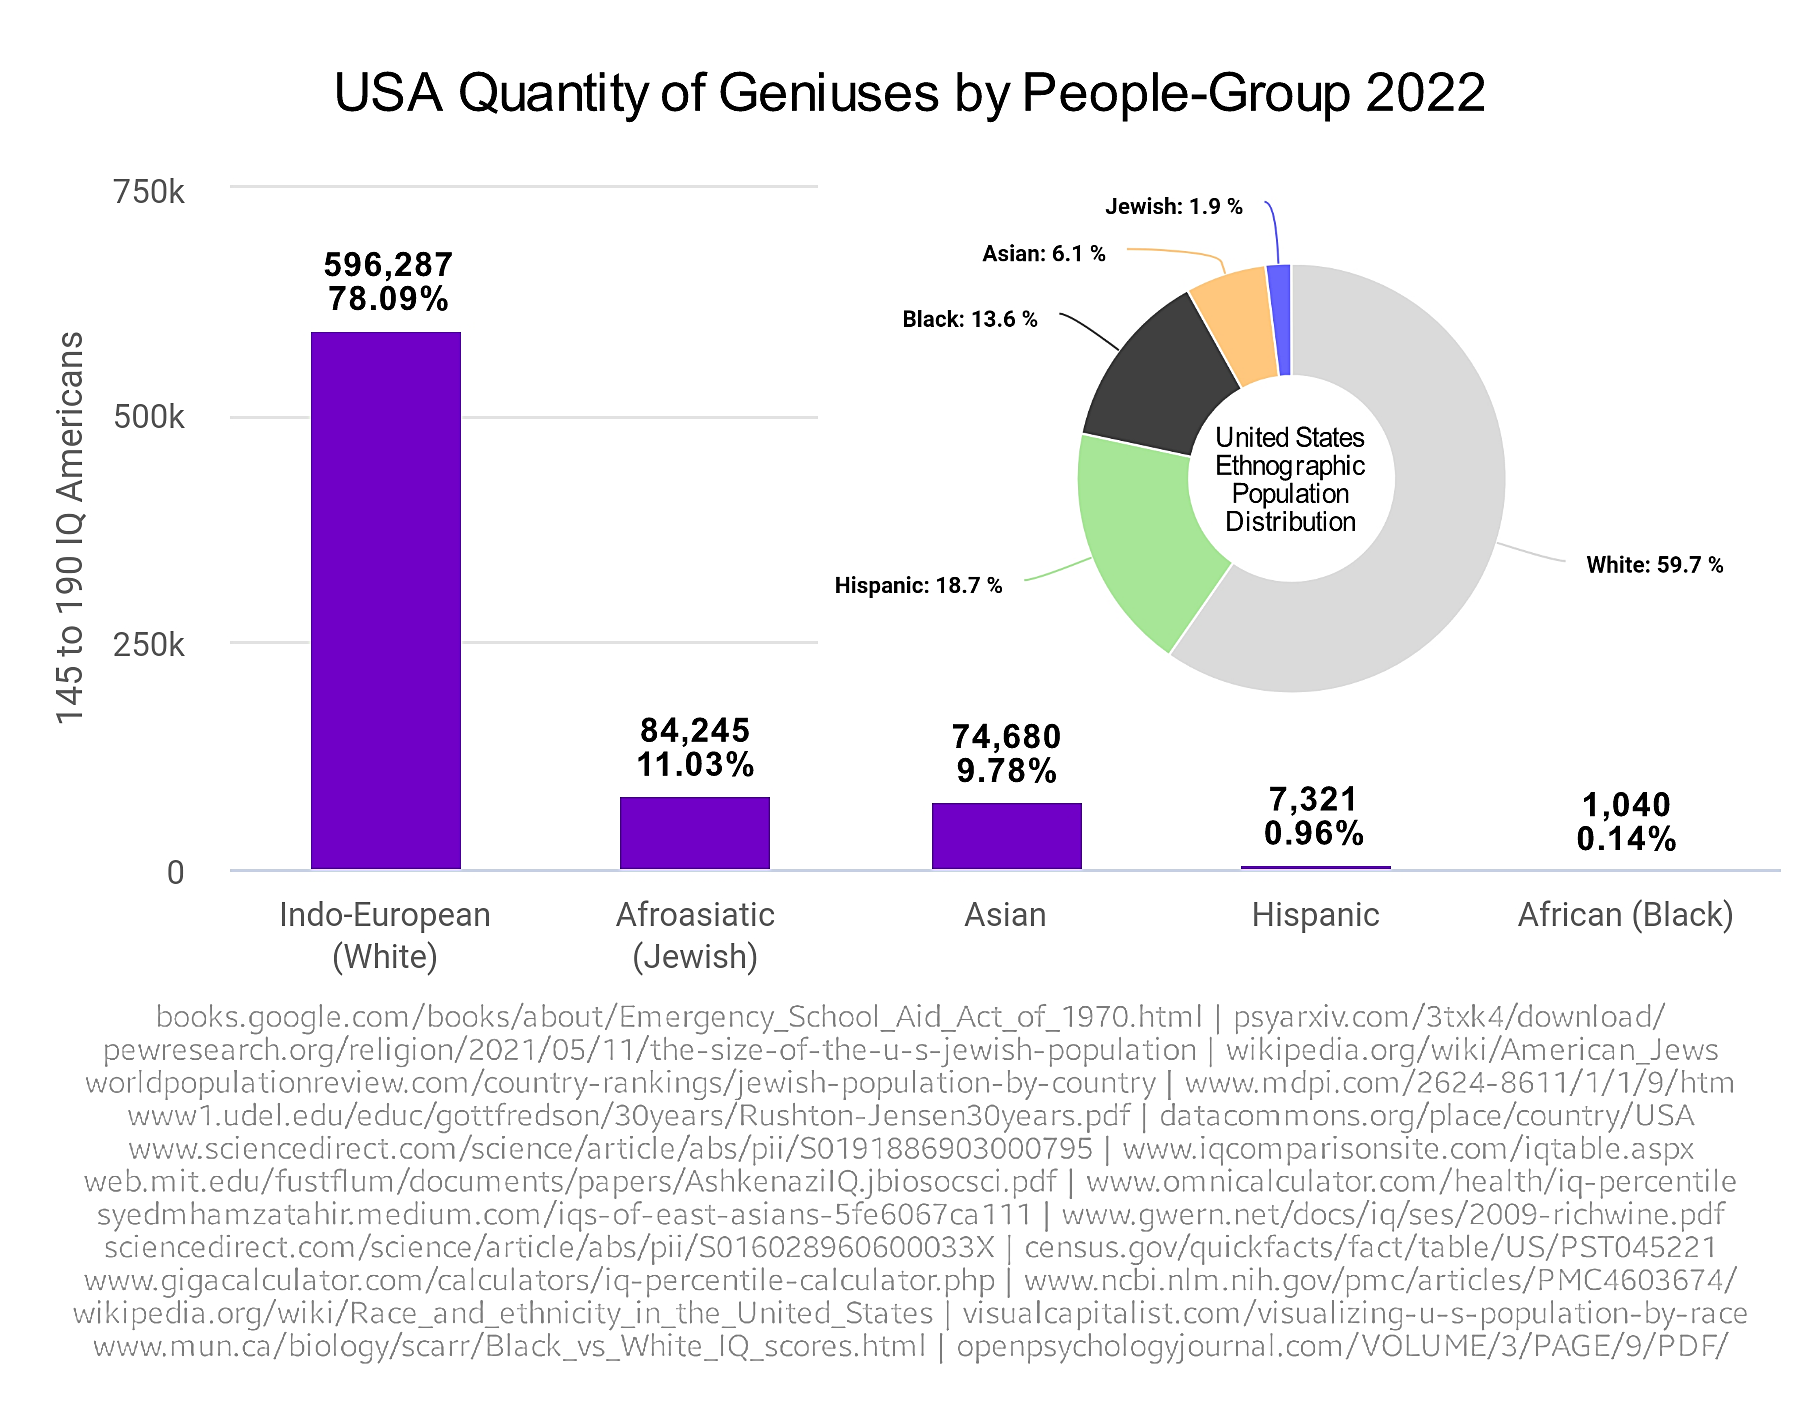
USA Quantity of Geniuses by People-Group 2022.
#usa #demographics #ethnography #genius #geniuses #americaniq #iq #americangenius #americangeniuses #highiq #highiqamericans #smart #cerebral #intelligence #intelligent #intelligentamericans #usintelligence #intellectualcapacity #americaniqs #americaniq #americanintelligence #graphs #charts #math #statistics #stats #data #information #study #info #indoeuropean #afroasiatic #asian #hispanic #african #american
2 Likes
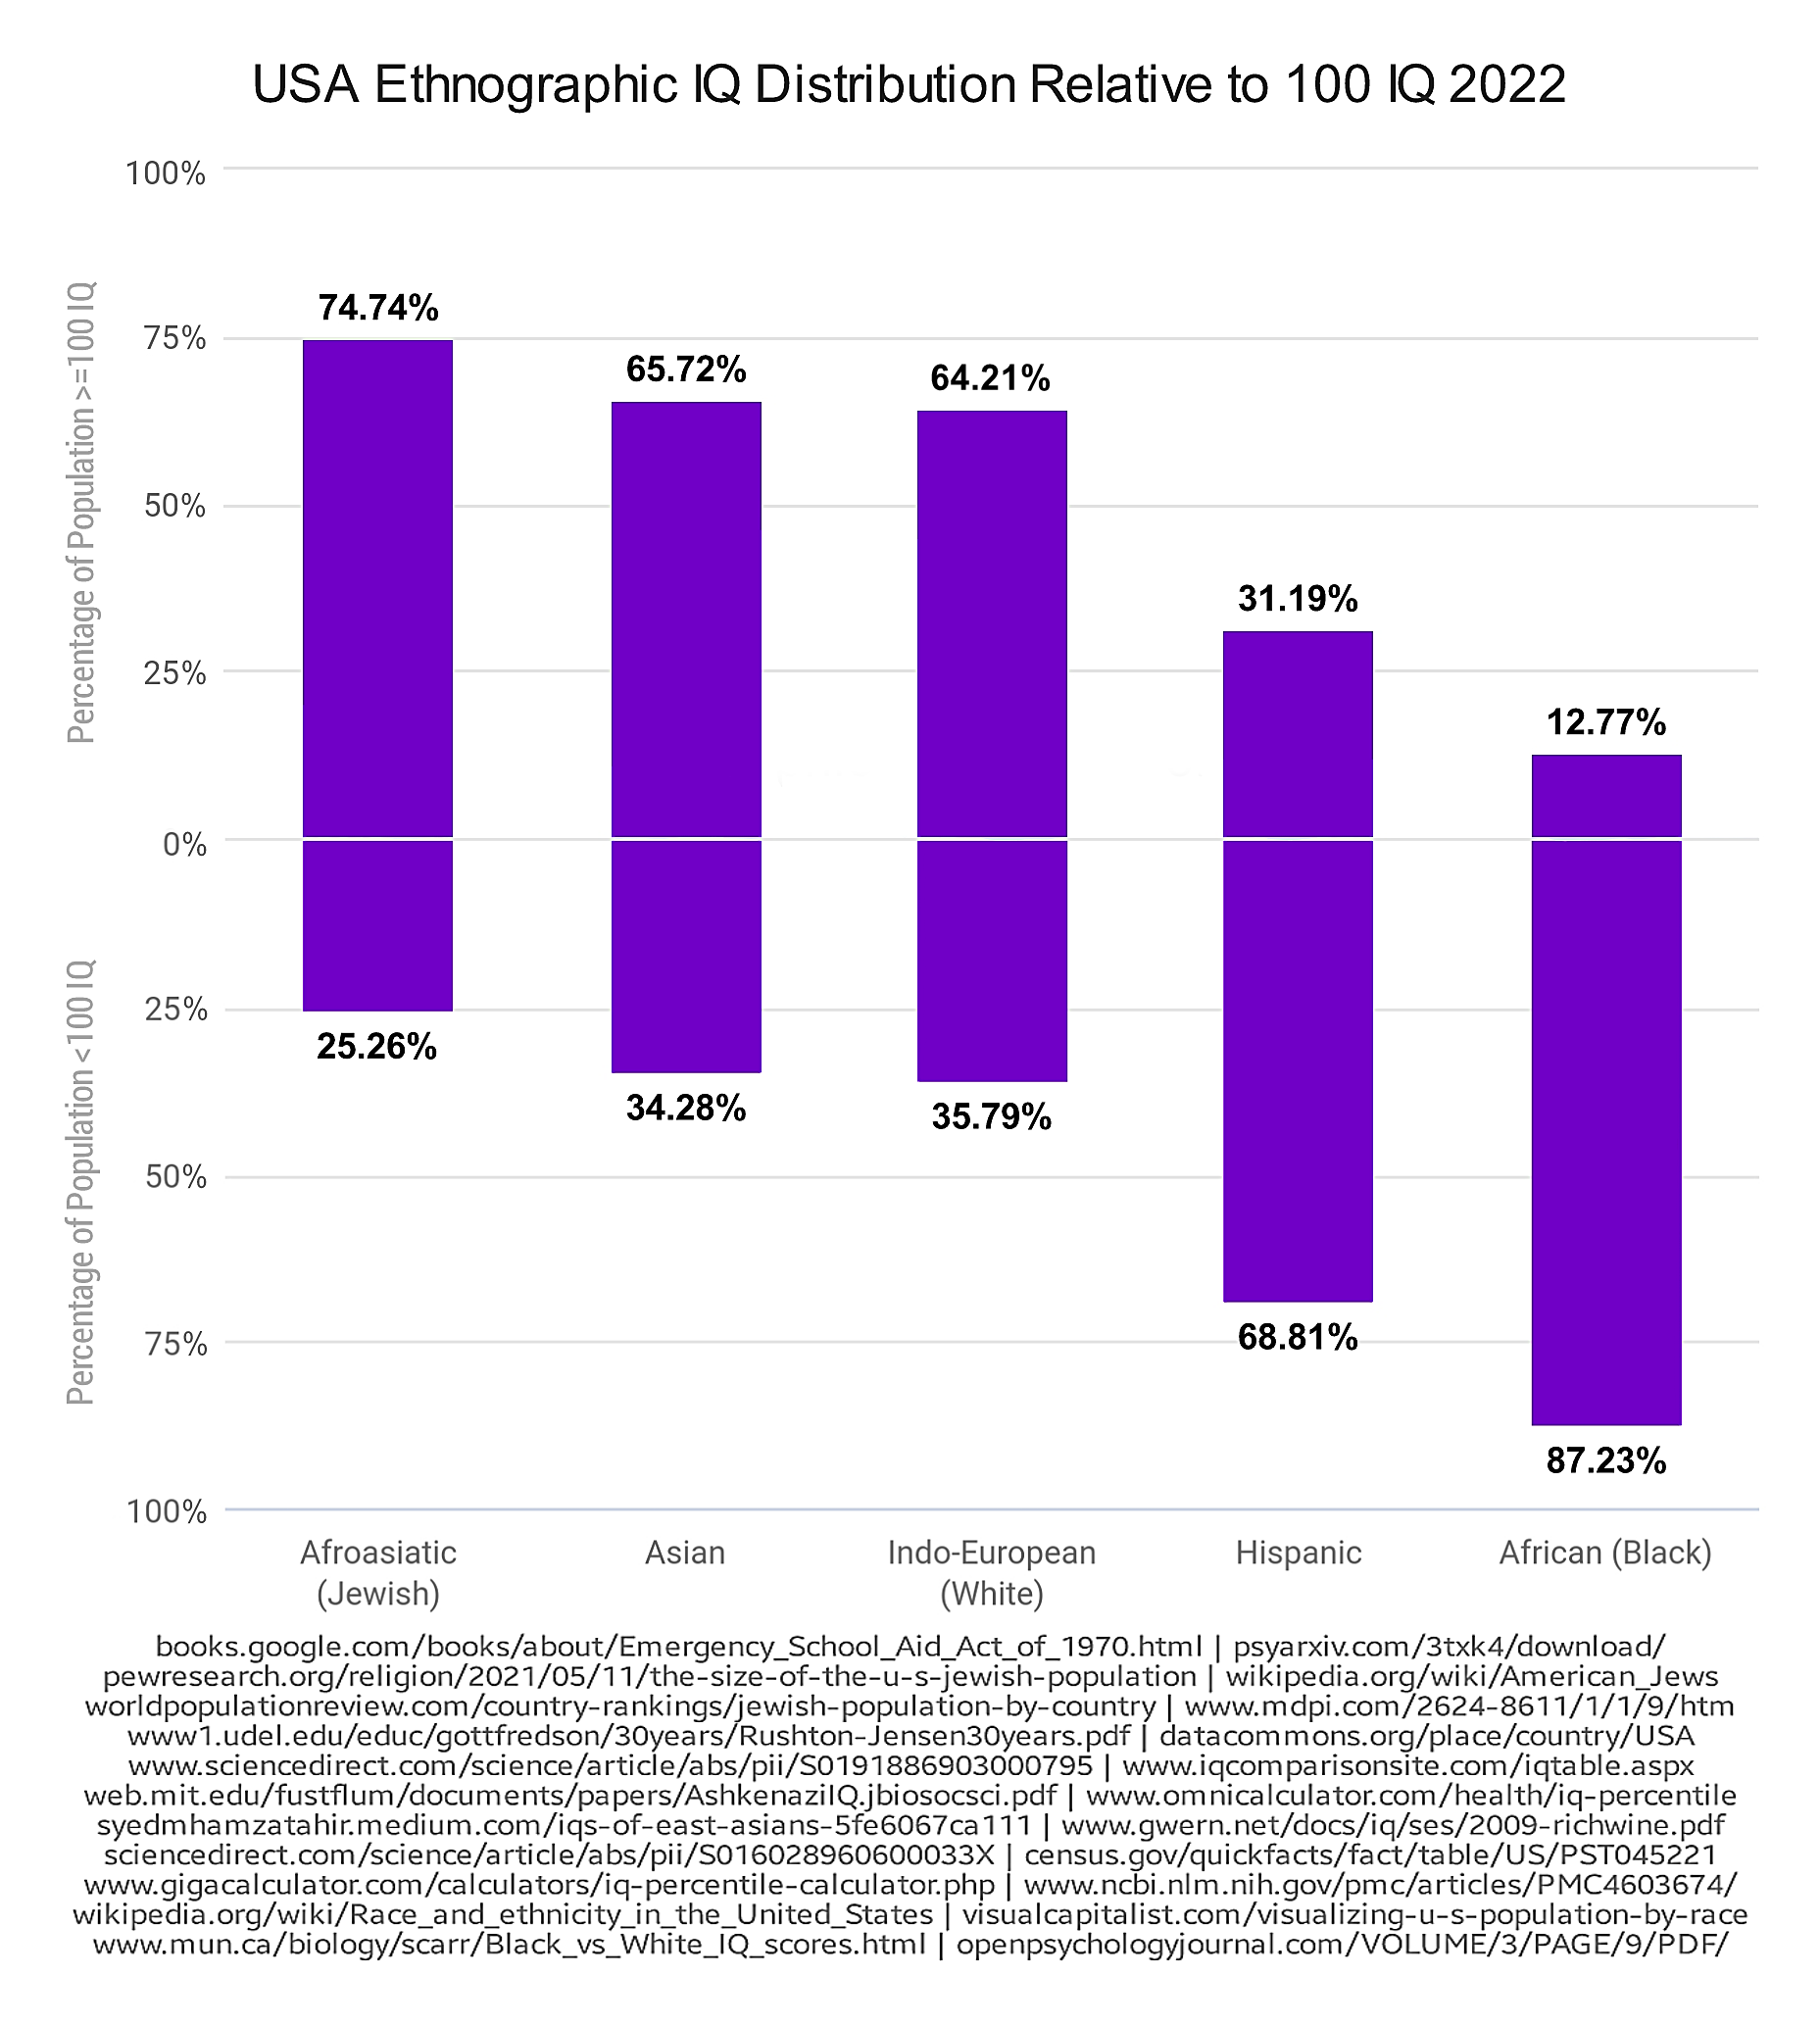
USA Ethnographic IQ Distribution Relative to 100 IQ 2022.
#iq #intelligencequotient #intelligence #intellect #cognition #comprehension #USA #demographics #ethnography #ethnicity #ethnolinguistics #analysis #afroasiatic #jewish #asian #white #indoeuropean #european #hispanic #southamerican #black #african #UK #africanamerican #anthropology #eu #sociology #cognitiveability #chart #graph #data #information #study
One person like that
3 Comments
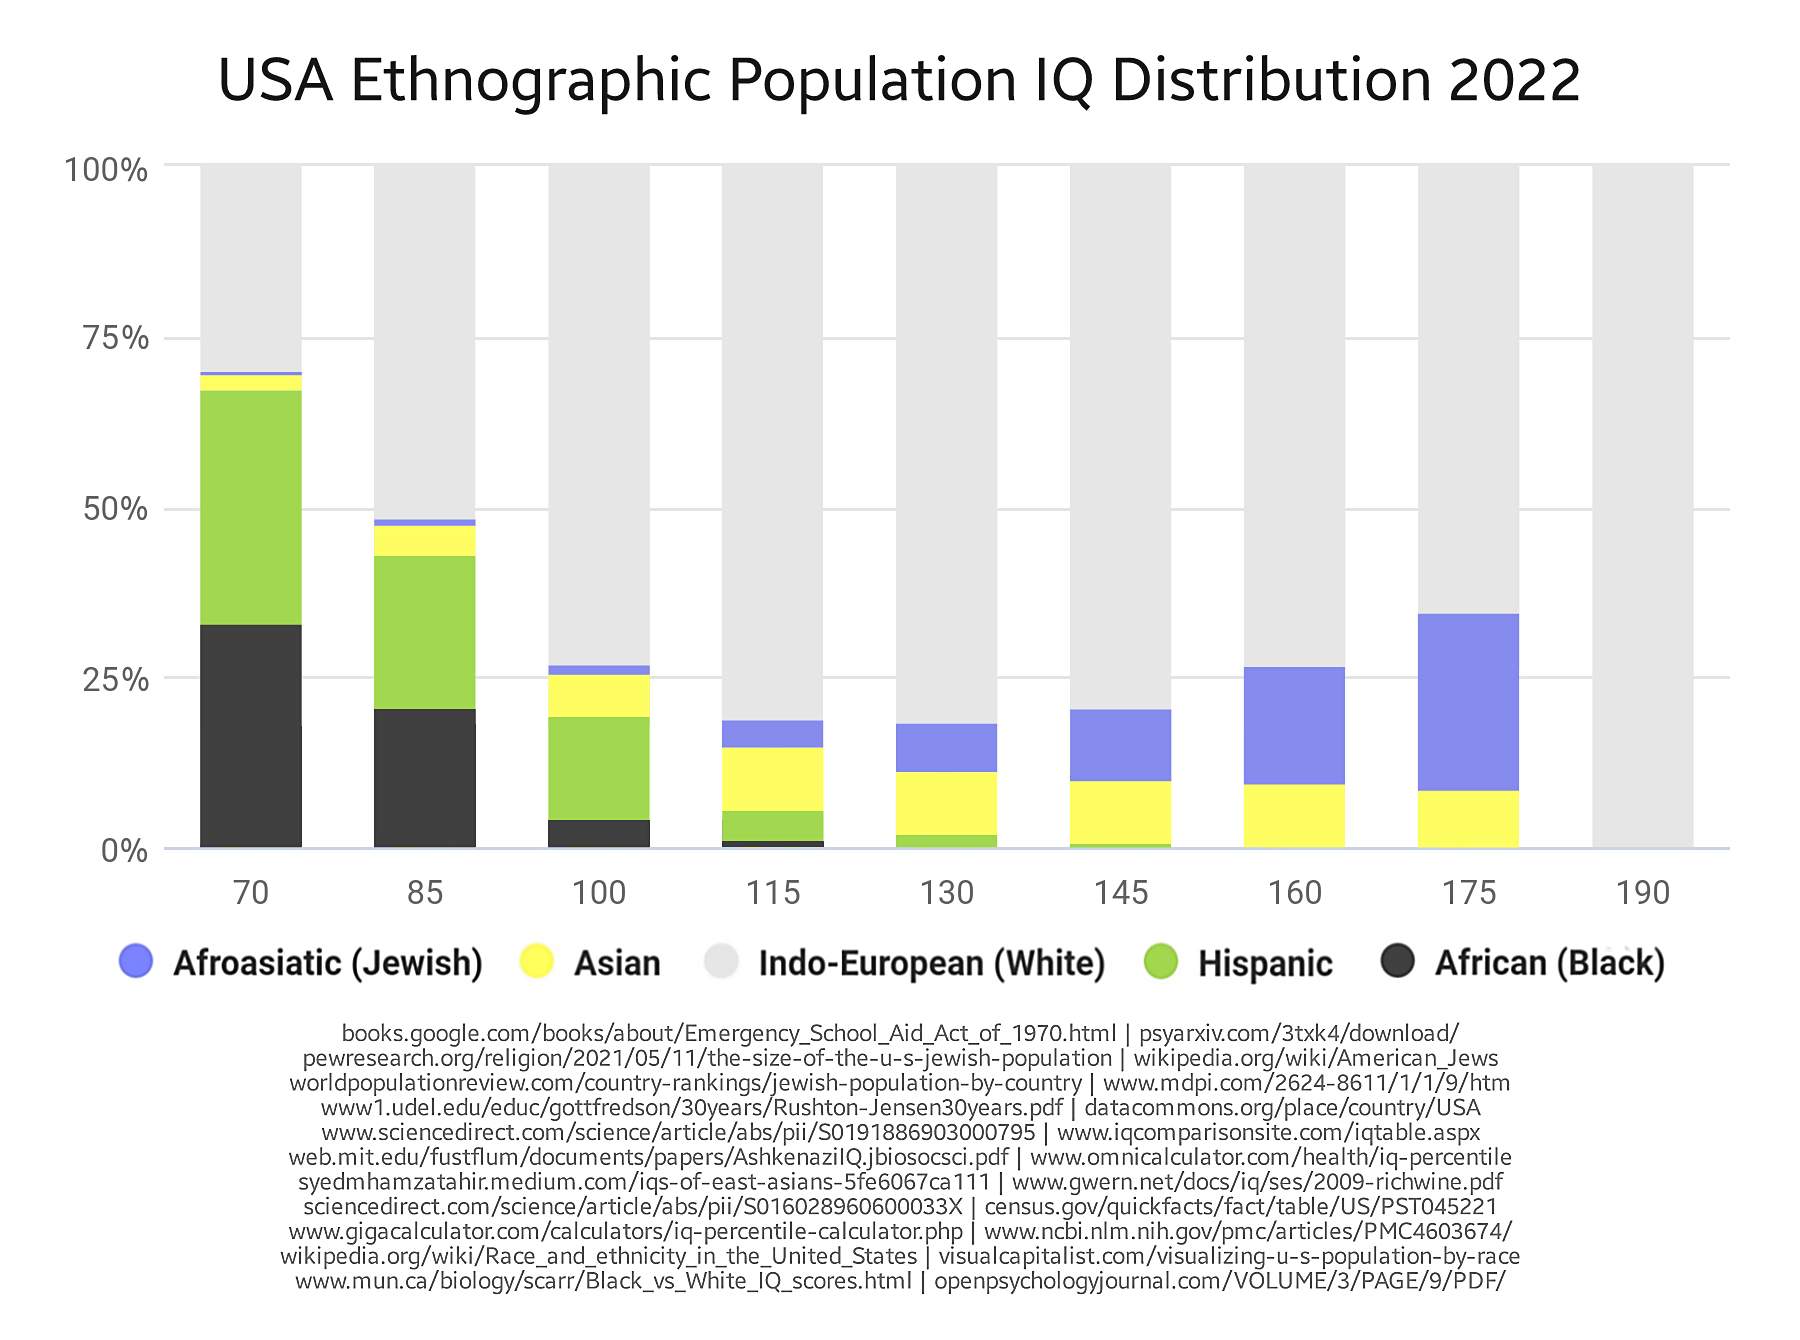
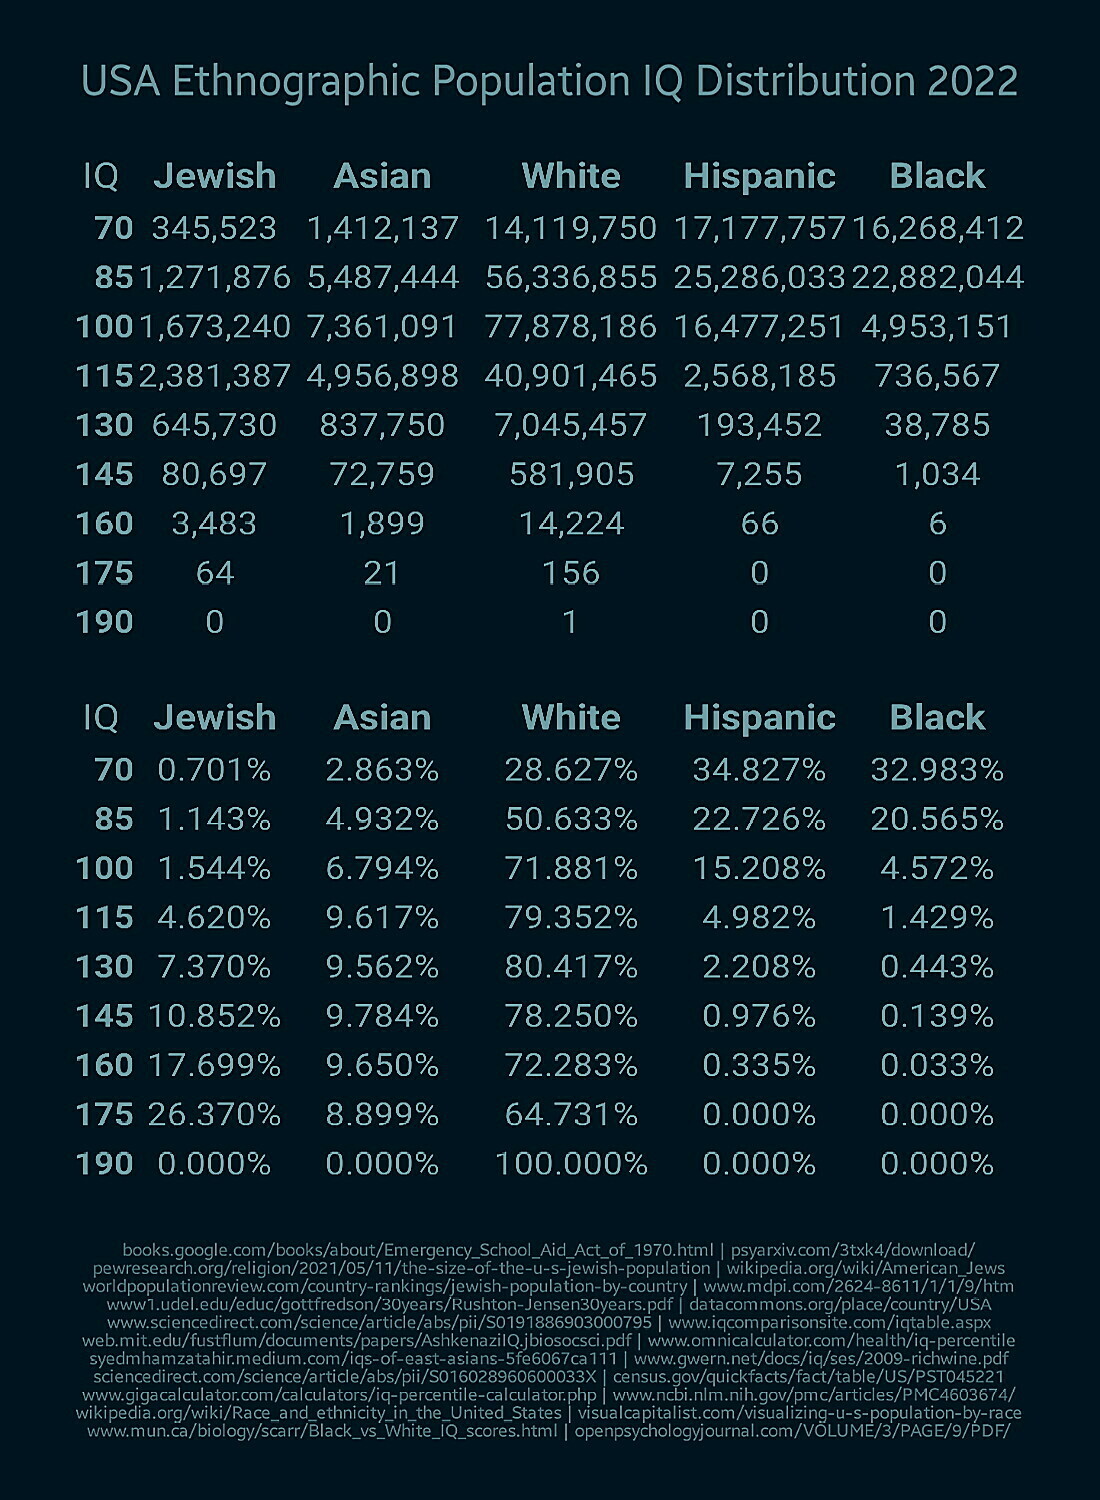
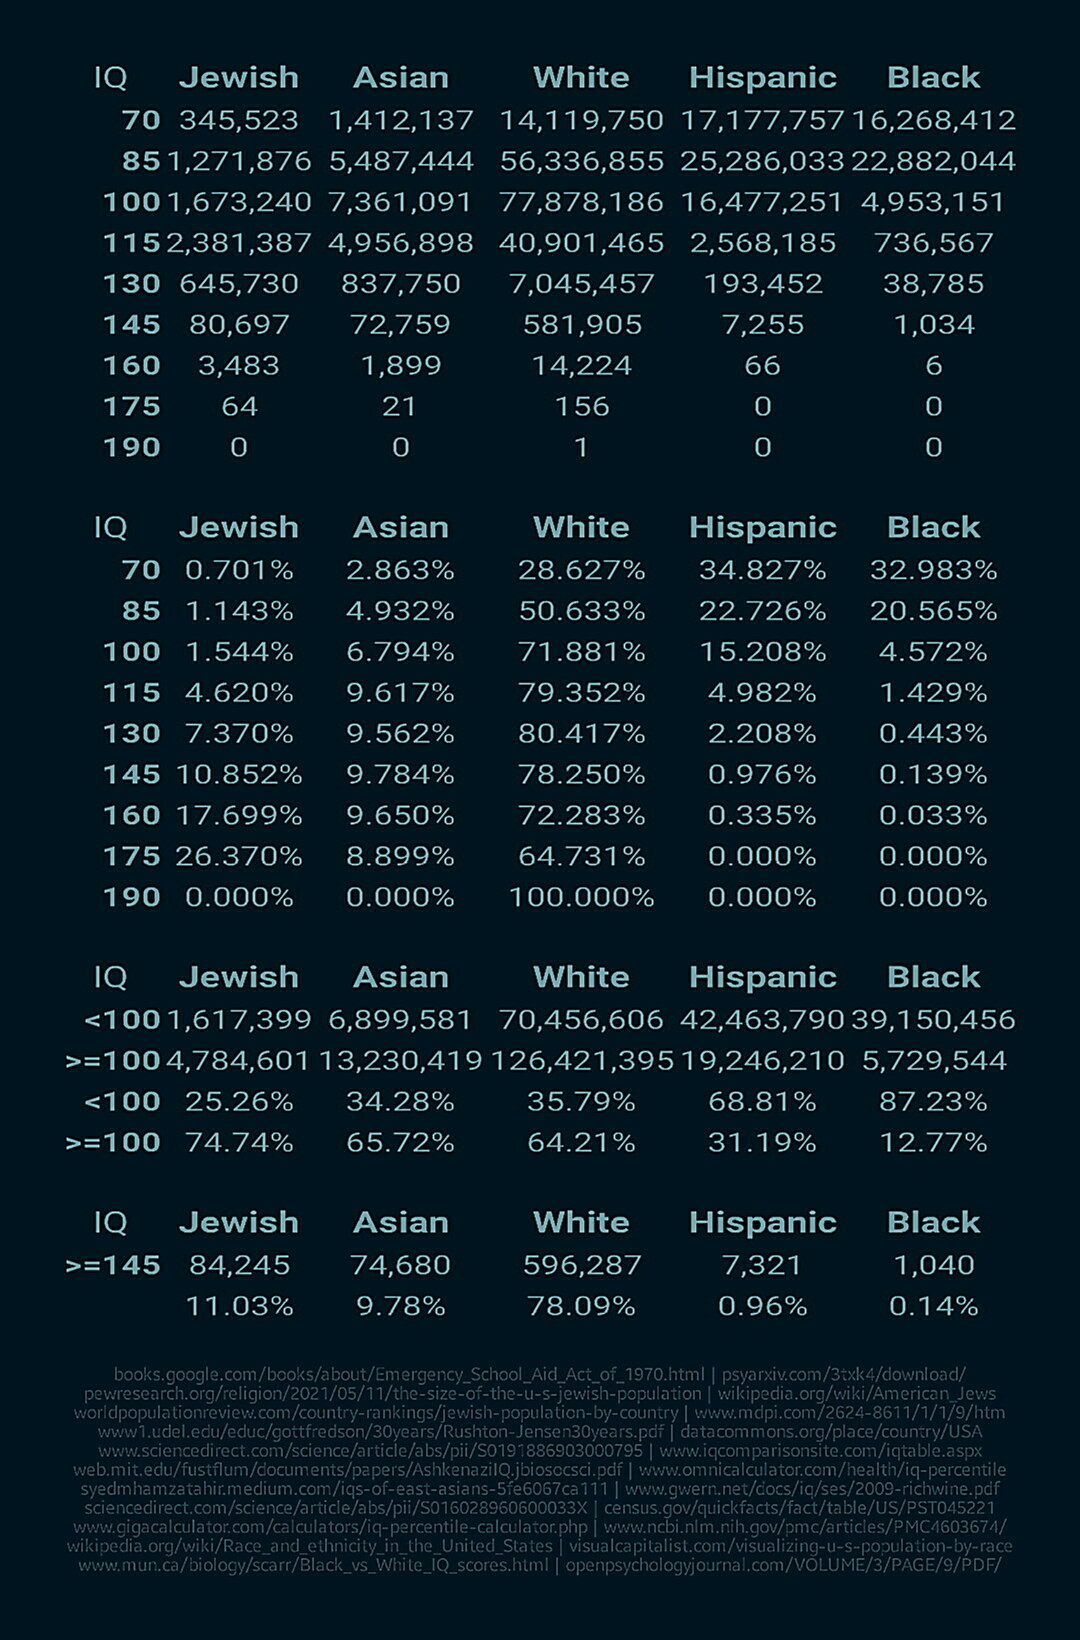
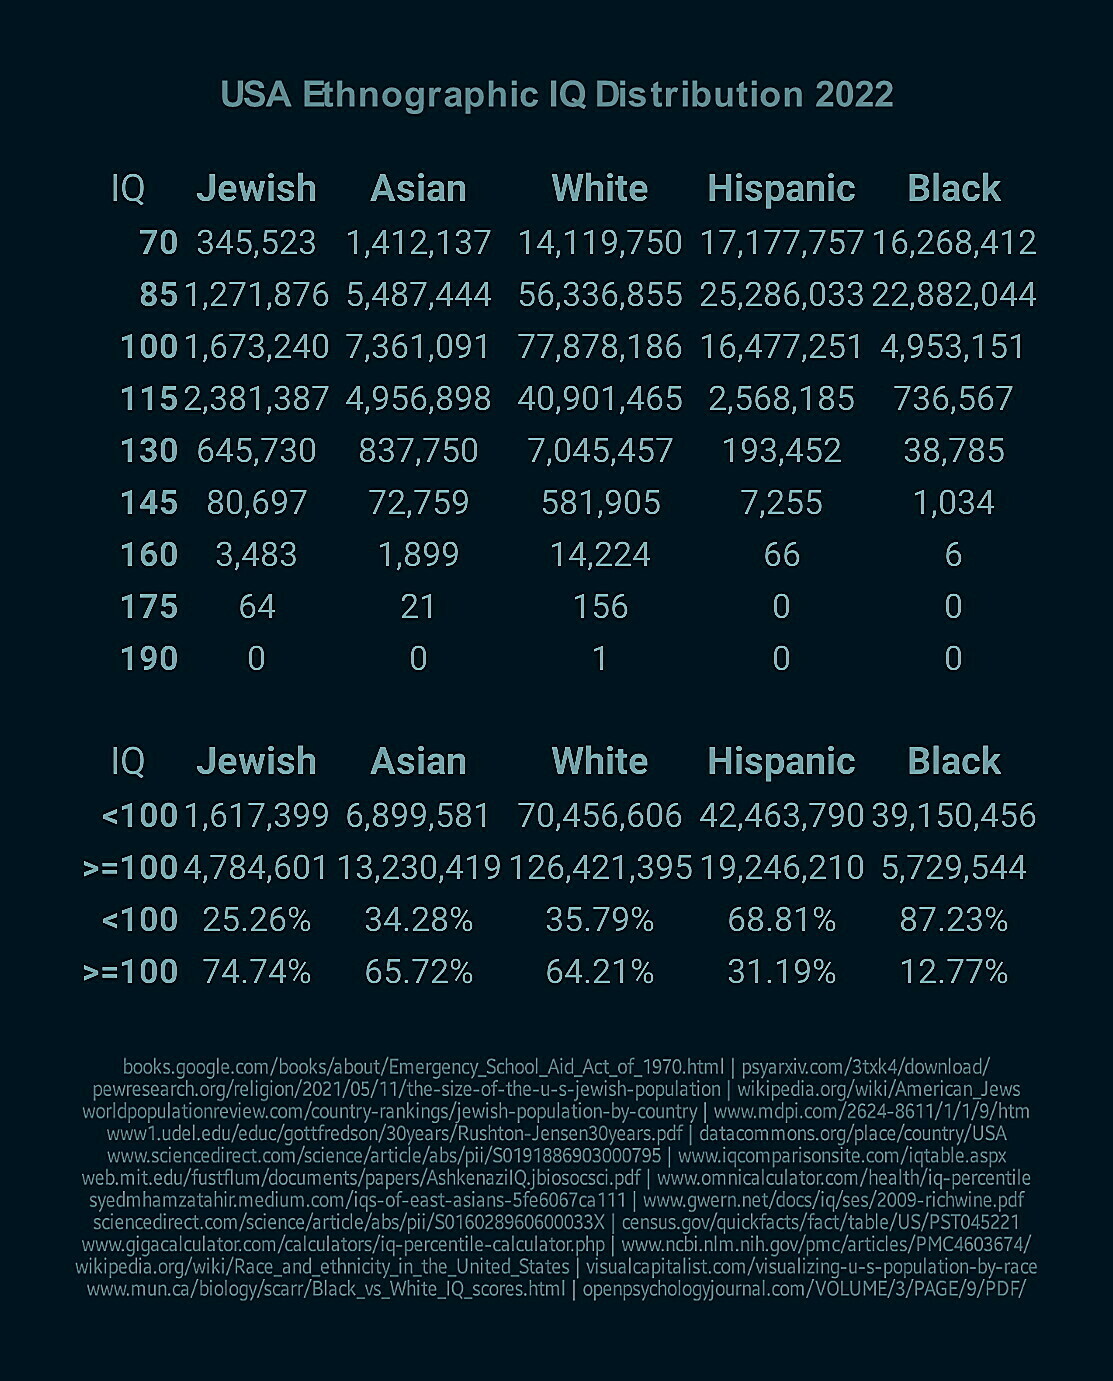
USA Ethnographic Population IQ Distribution 2022.
#iq #intelligencequotient #intelligence #intellect #cognition #comprehension #USA #demographics #ethnography #ethnicity #ethnolinguistics #analysis #afroasiatic #jewish #asian #white #indoeuropean #european #hispanic #southamerican #black #african #UK #africanamerican #anthropology #eu #sociology #cognitiveability #chart #graph #data #information #study
11 Comments
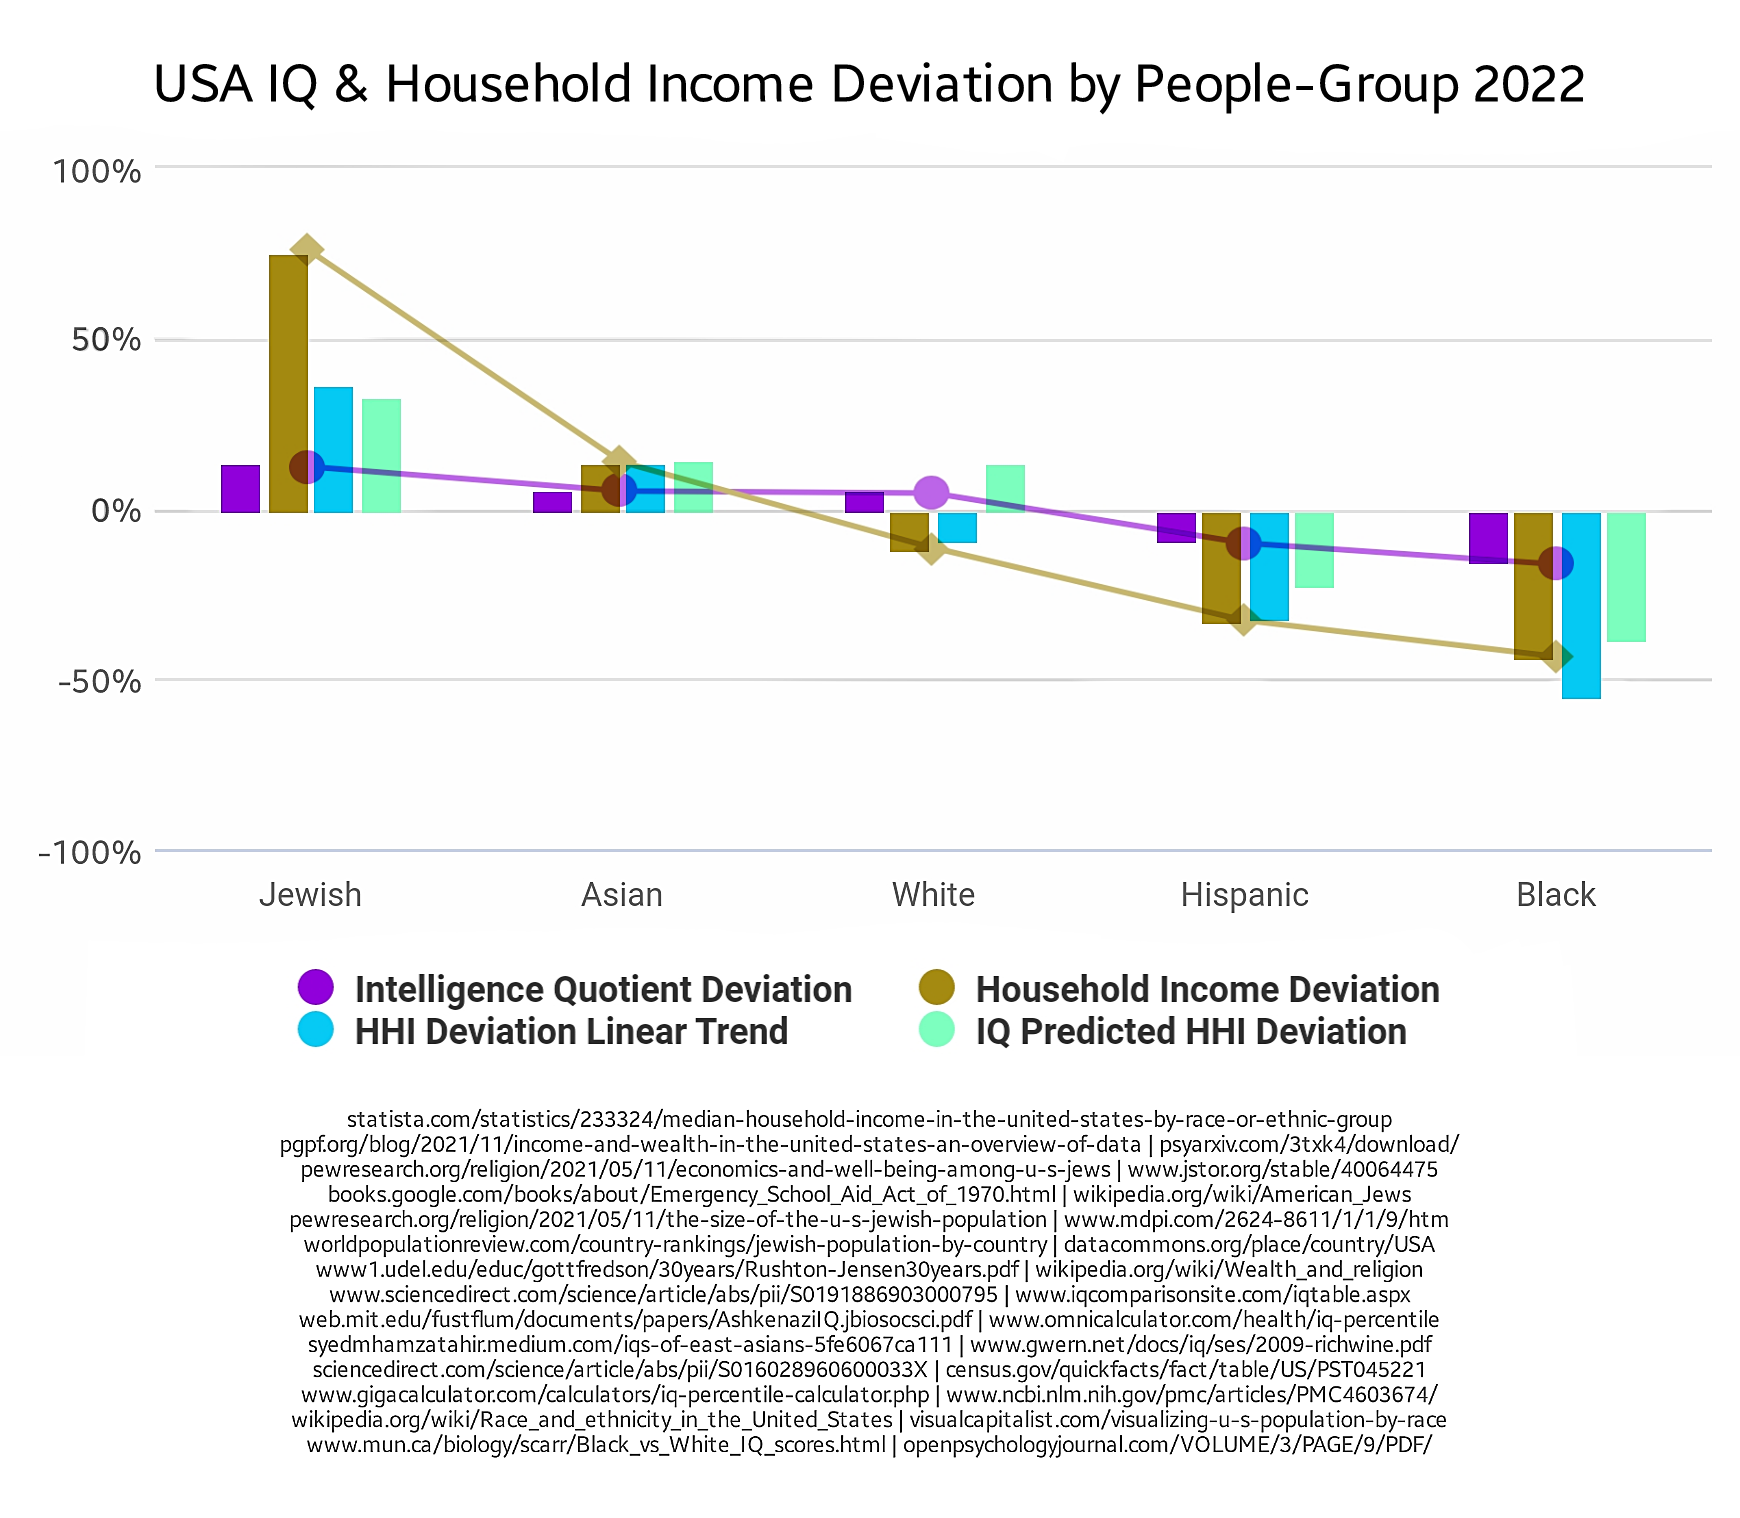
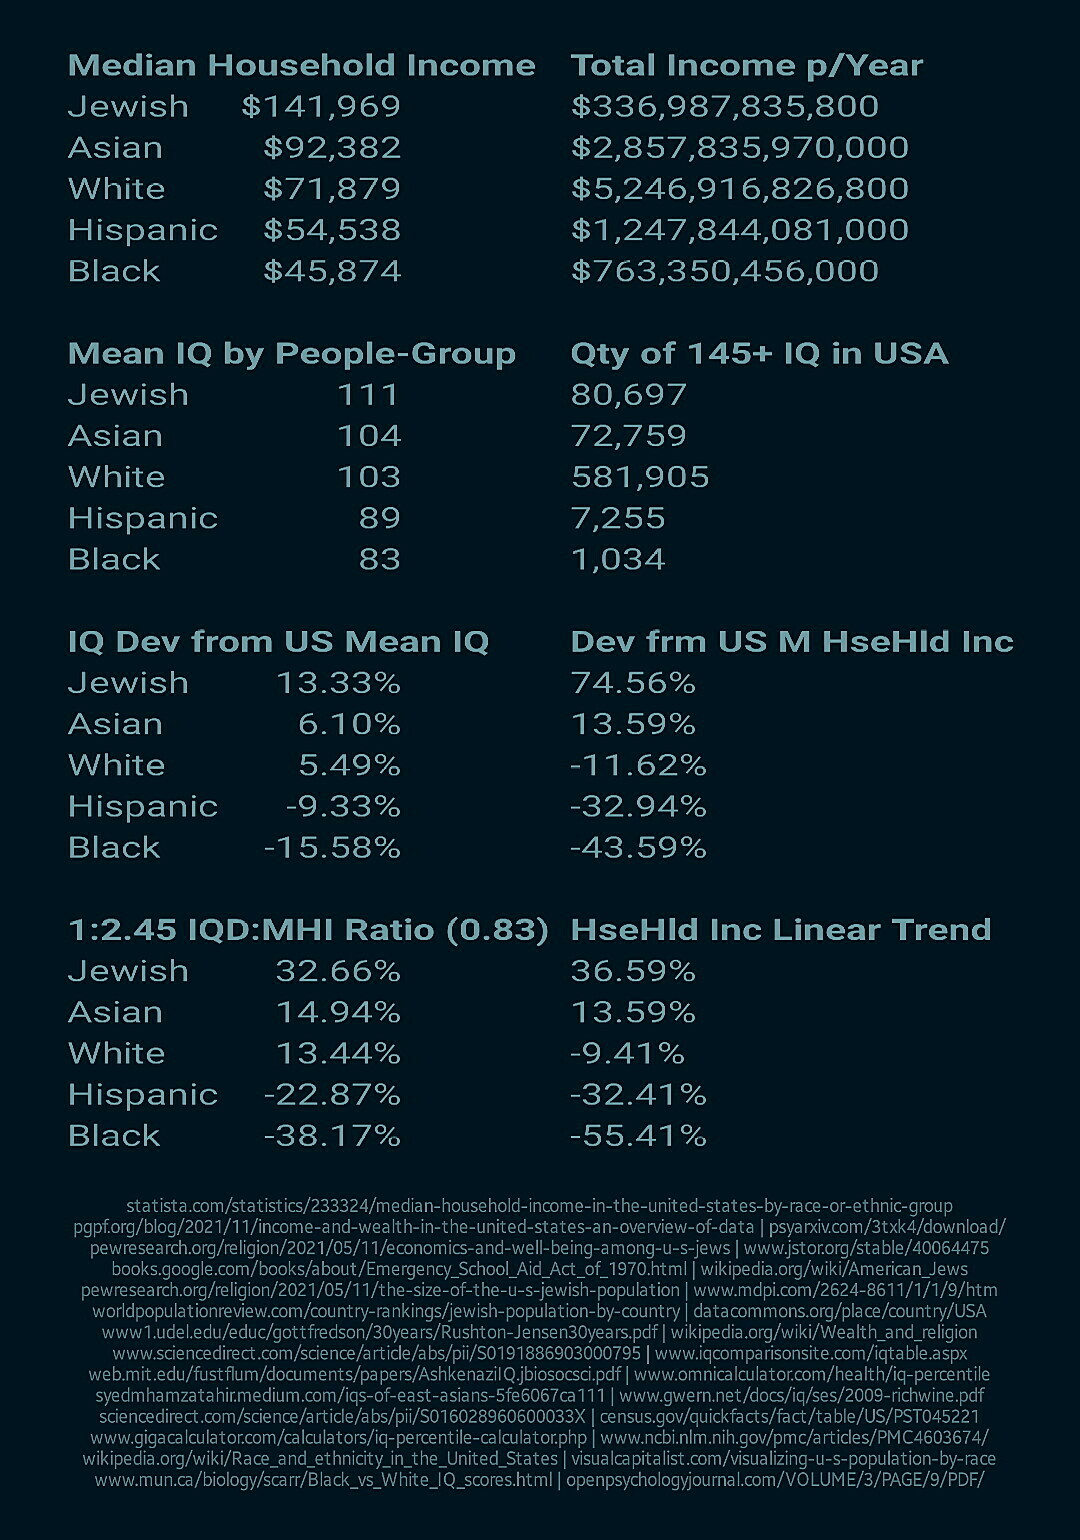
USA IQ & Household Income Deviation by People-Group 2022.
#usa #demographics #ethnography #iq #intelligence #intelligencequotient #intellectualability #ethnicity #race #peoplegroups #ethnolinguistics #statistics #stats #data #graph #chart #information #jewish #jews #afroasiatic #asian #asiatic #white #indoeuropean #european #hispanic #southamerican #black #african #africanamerican #householdincome #medianhouseholdincome #money #anthropology #sociology #income #economics #socioeconomics
Fertility of mega-urban regions 2020. Only 8 cities, Jakarta (Indonesia), Manila (Philippines), Cairo (Egypt), Karachi (Pakistan), Lagos (Nigeria), Johannesburg (South Africa), Lahore (Pakistan), and Kinshasa (DR Congo), out of 41 on the list, had fertility rates above replacement rate. At the top of the list is "Pearl River Delta", which is Shenzhen (China) and the surrounding metropolitan area (Dongguan, Foshan, Huizhou, Jiangmen, Zhongshan), with 55.7 million people and a total fertility rate of 1.10 children per woman, Tokyo (Japan) with 38.4 million people and a fertility rate of 1.2, Shanghai (China) with 38.0 million people and a fertility rate of 0.95, and Dehli (India) with 30.3 million people and a fertility rate 1.6. The table also shows fertility rates for the country the metro area is in, and you can see it is lower for all 41 metro areas on the table. Which suggests that urbanization causes fertility declines. Though correlation is not causation, as the famous saying goes, so you still have to prove causation. From a Twitter account called "Birth Gauge (@BirthGauge)", a Twitter account apparently created solely for "tracking the global fertility decline".
Fertility of mega-urban regions 2020
#demographics #fertility #urbanization
Table of fertility rates in the world's largest metropolitan areas. Only 6 of the world's 39 mega-urban regions (with a population greater than 10M) are above replacement level. pic.twitter.com/ly5Ww82yw1
— Birth Gauge (@BirthGauge) April 10, 2022
2 Likes
1 Shares
Well, this is sort of interesting (and debate-ready).
I was amused by the map according to a New Yorker's world view...
But I find it bewildering on the map of which other states get demonized, by state. Could it really be that Floridians hate Florida, Texans hate Oklahoma, and a big chunk of the west hates California?
These Maps Portray the U.S. More Accurately Than Anything We Learned in School
Cute display of favorite search terms. Might generate both laughter and argument. Fun.
But like the first graphic, there's no source given, and it's unclear how much is data-driven vs. impressionistic.
2 Likes
3 Comments