#ethnicgroups

tpq1980@iviv.hu

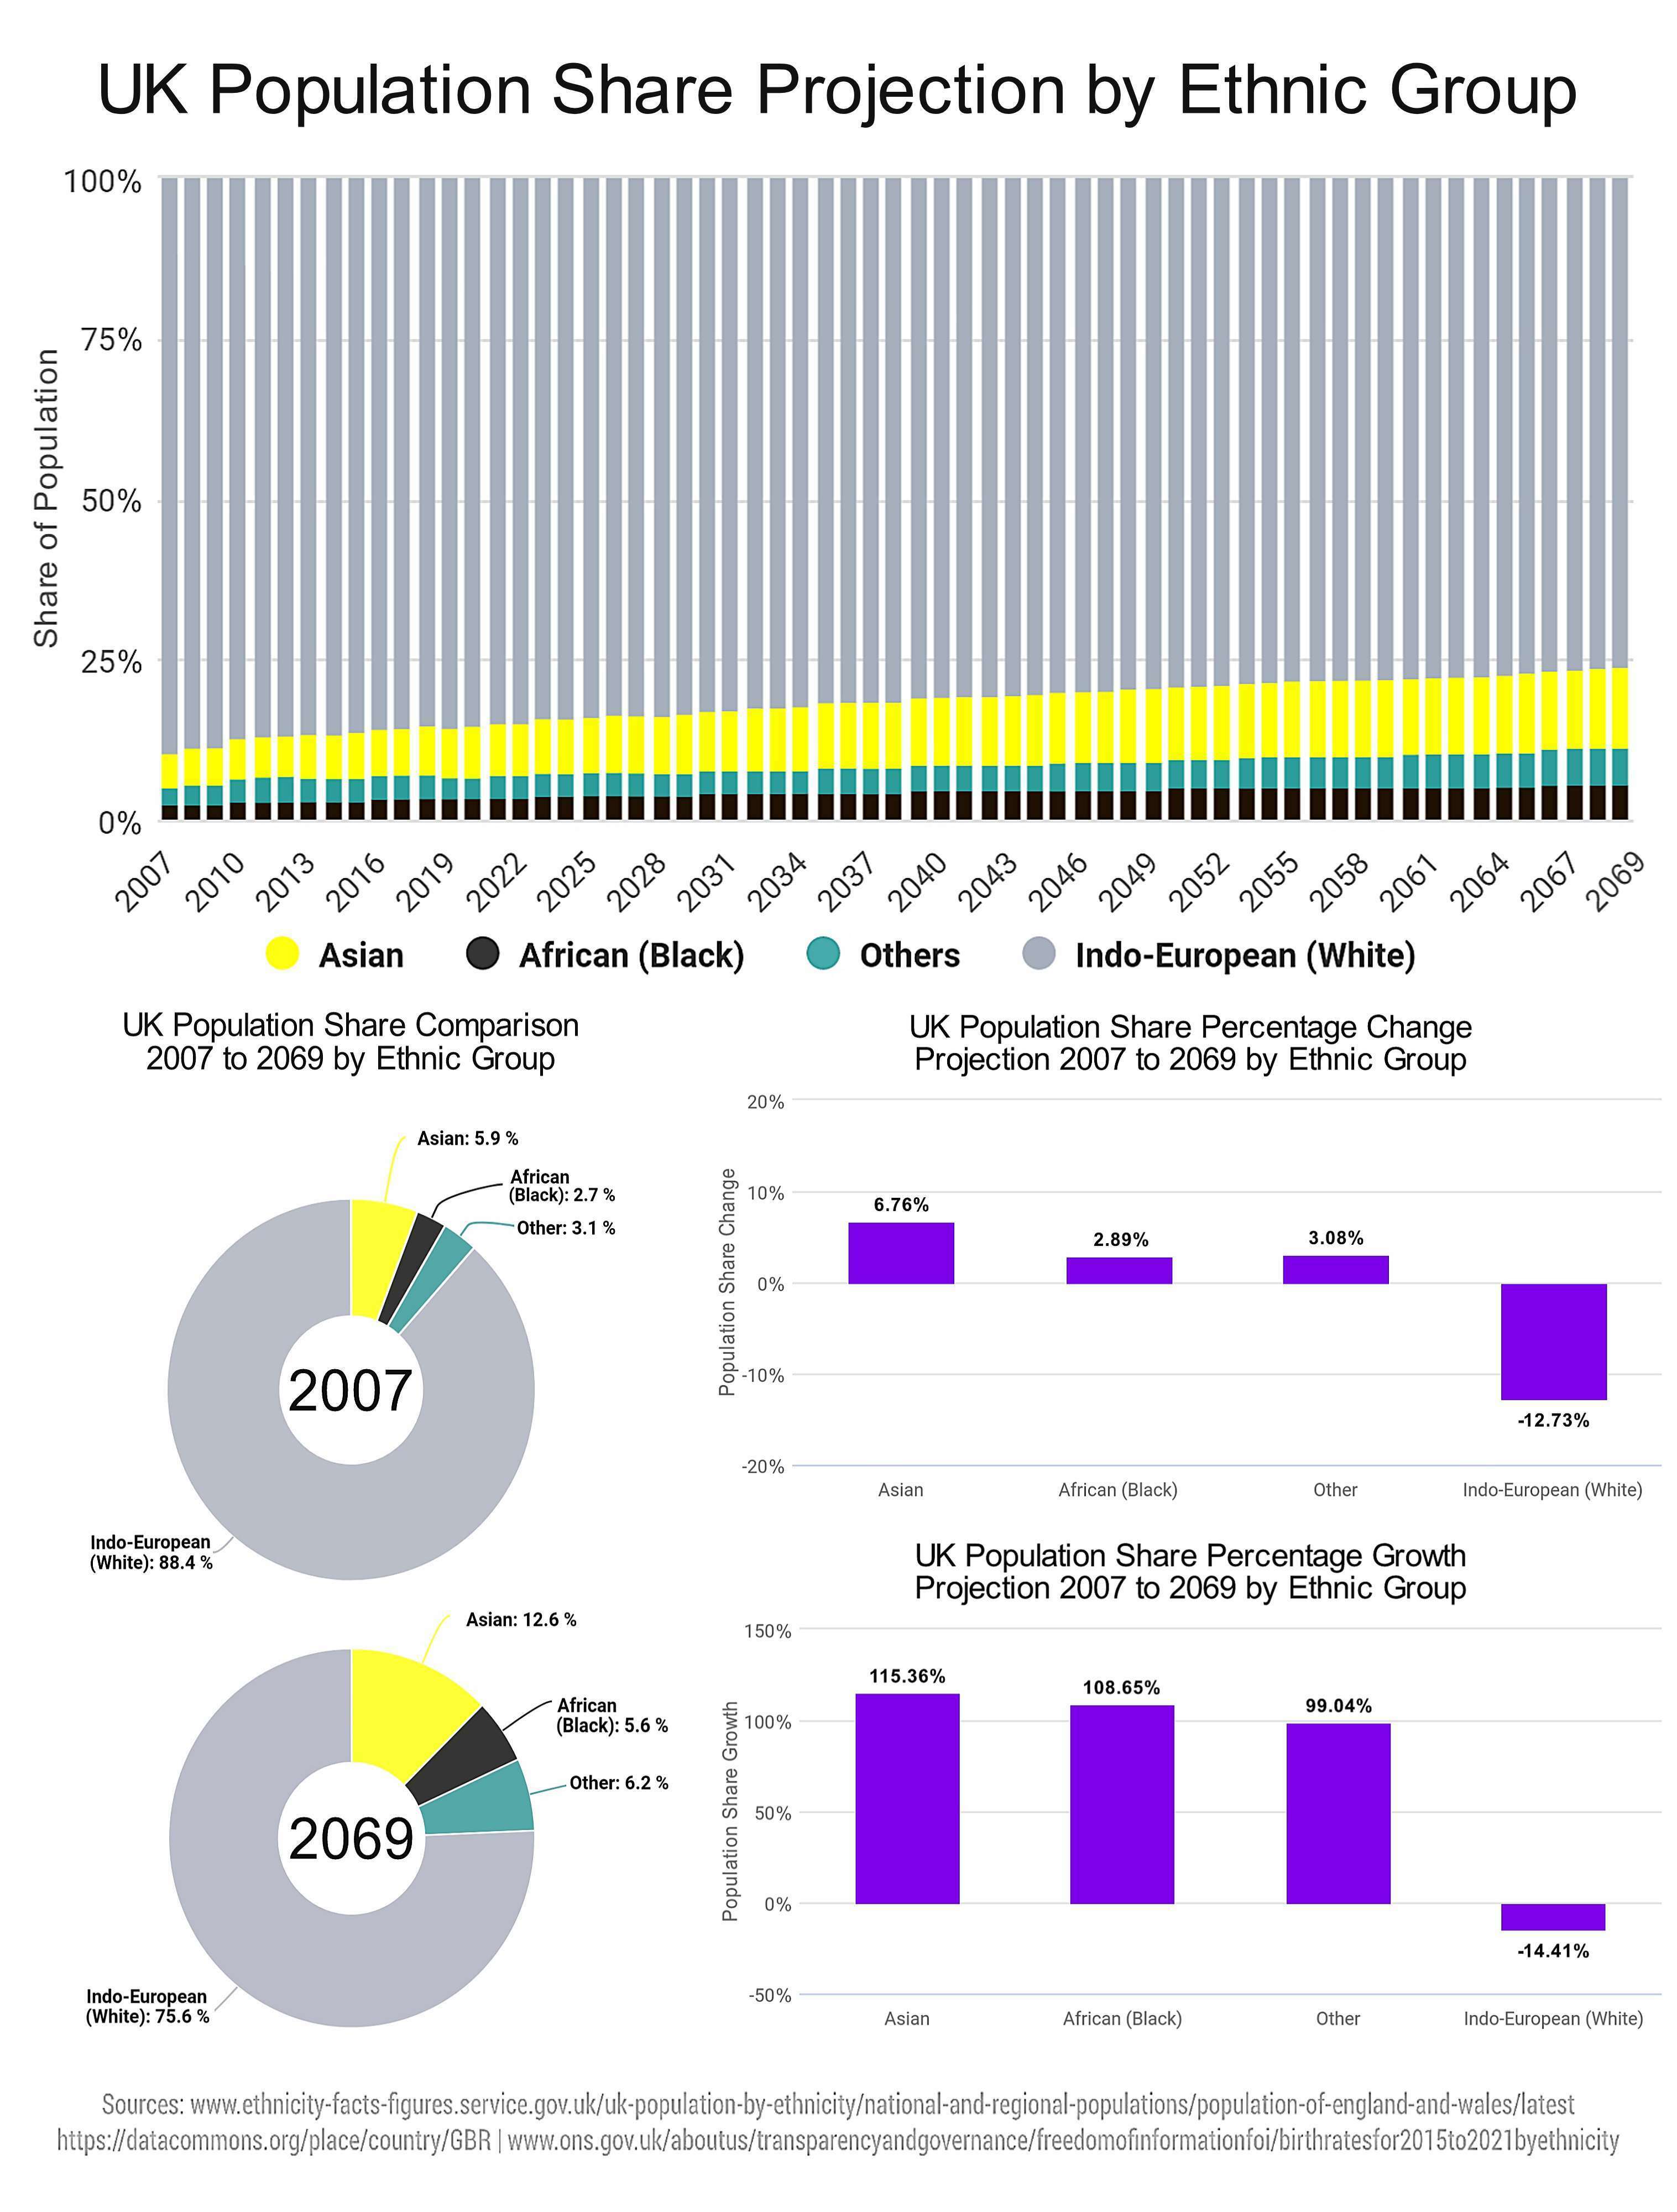
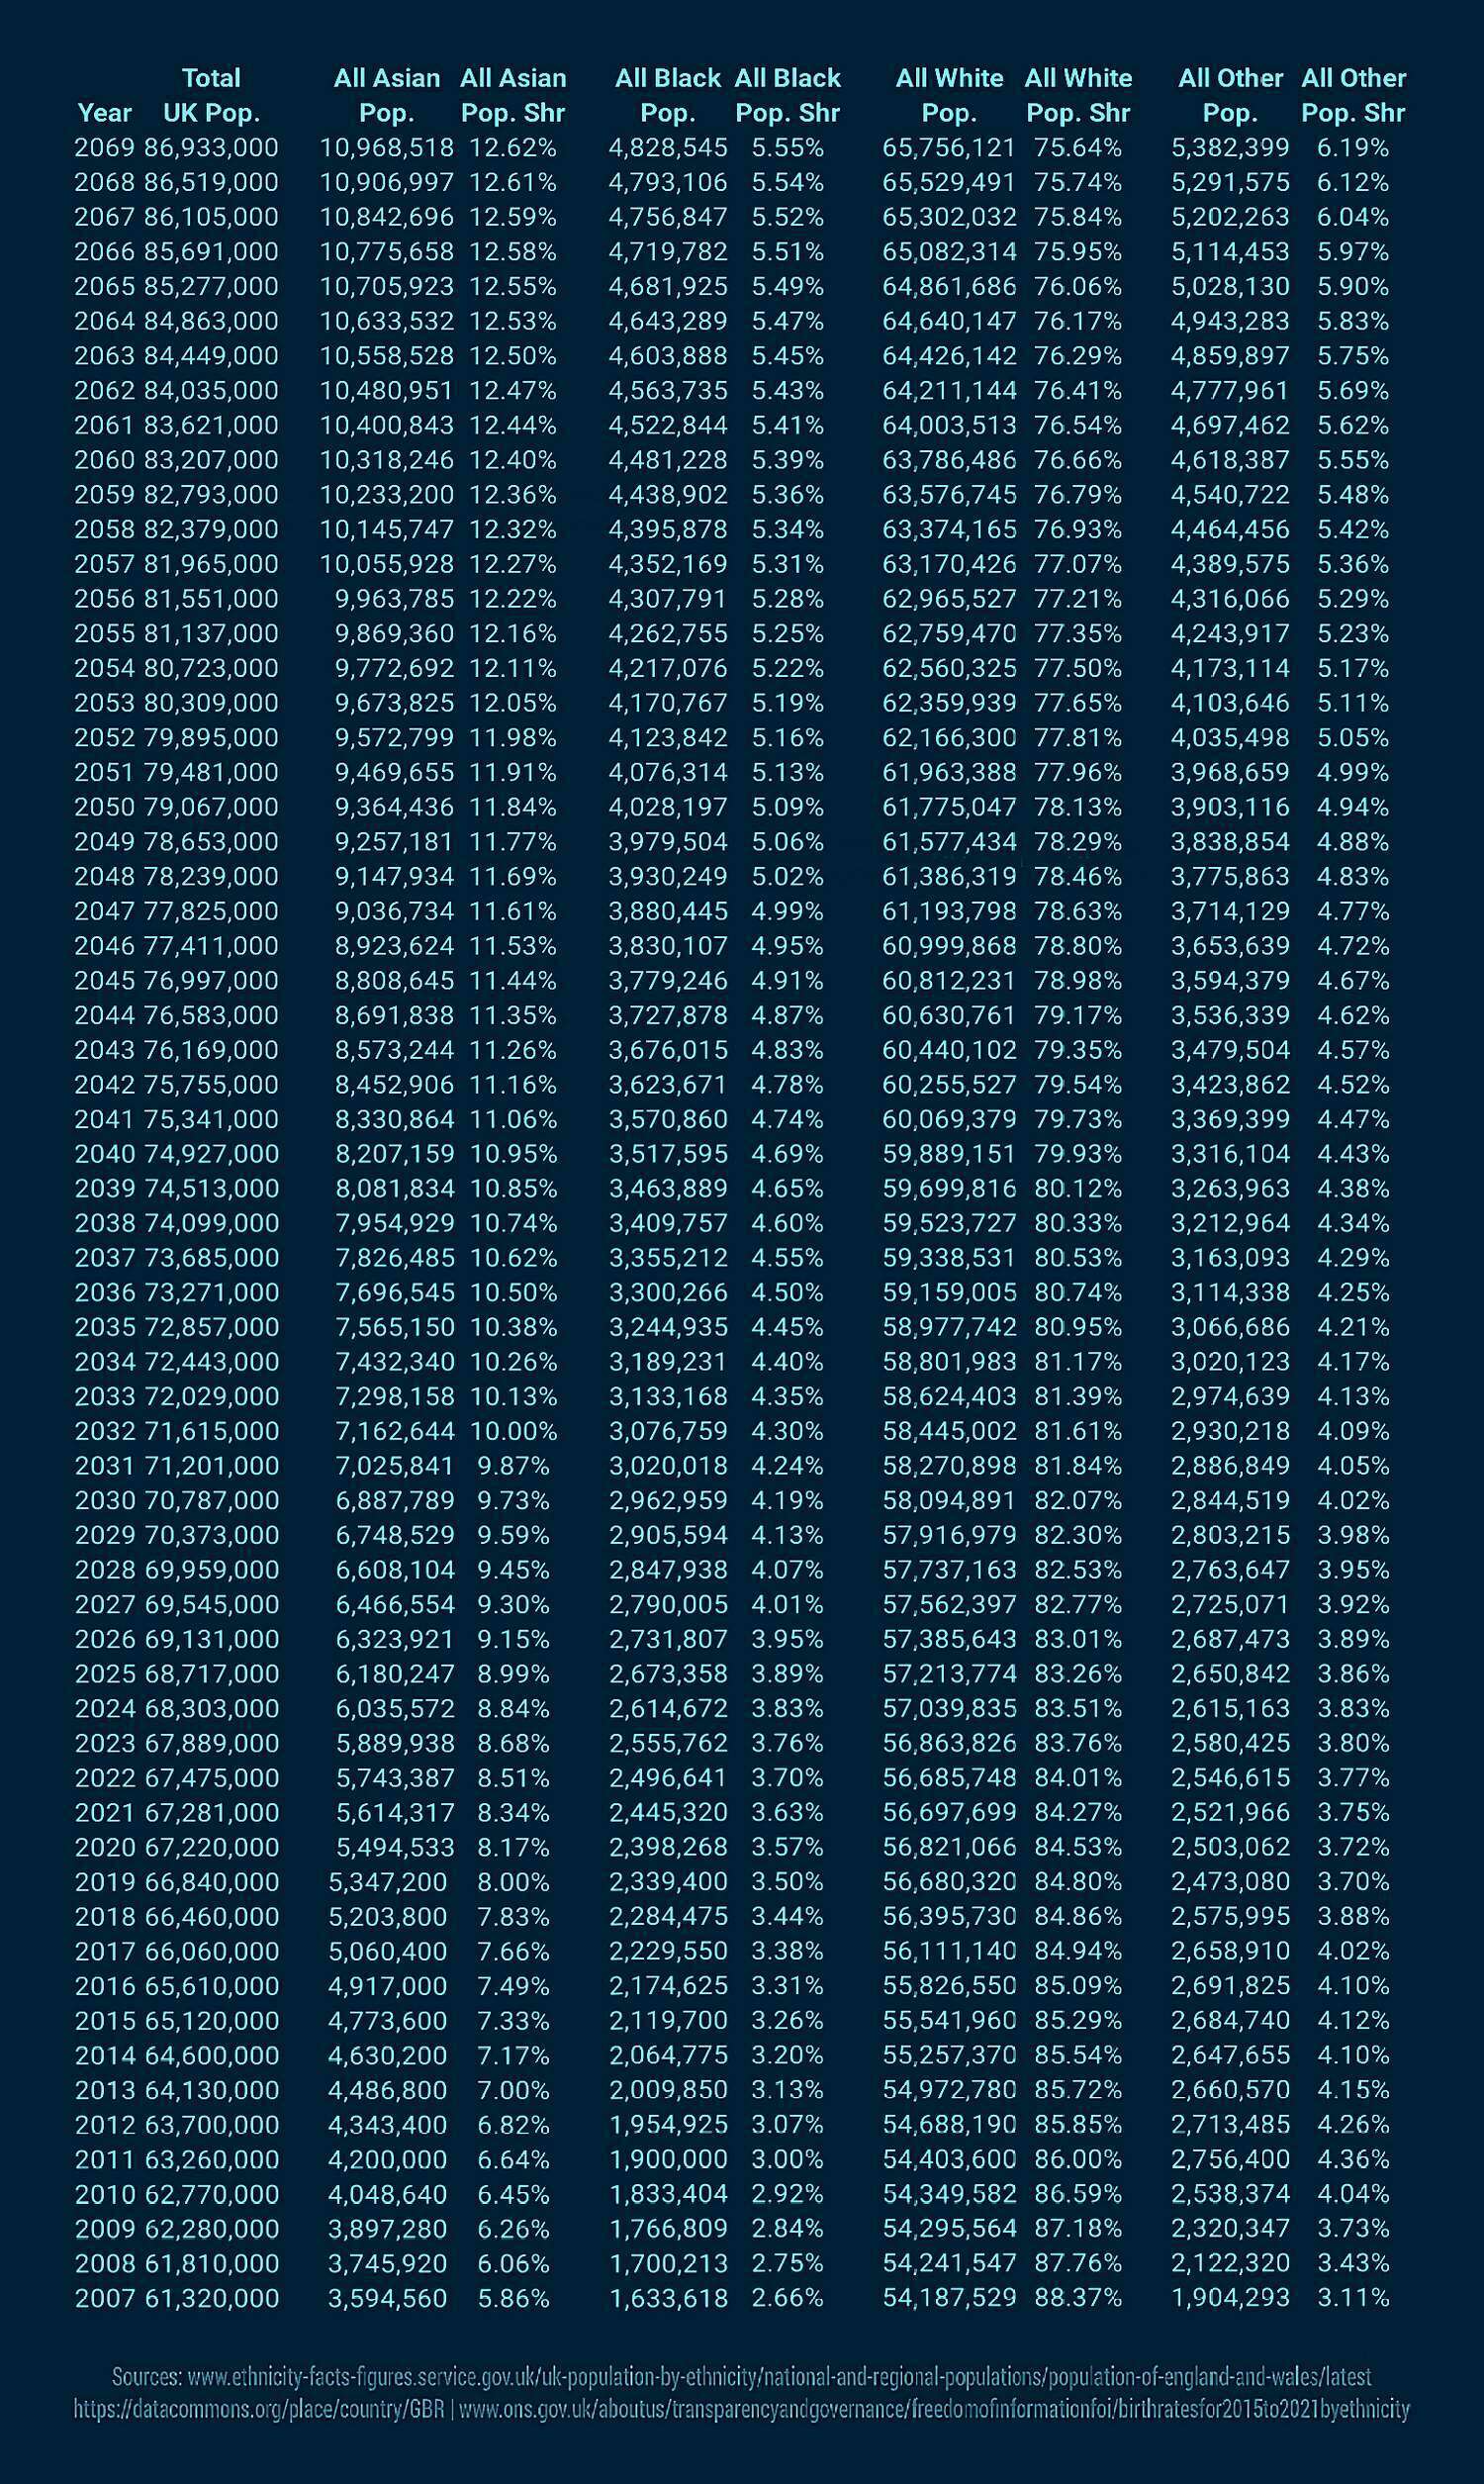
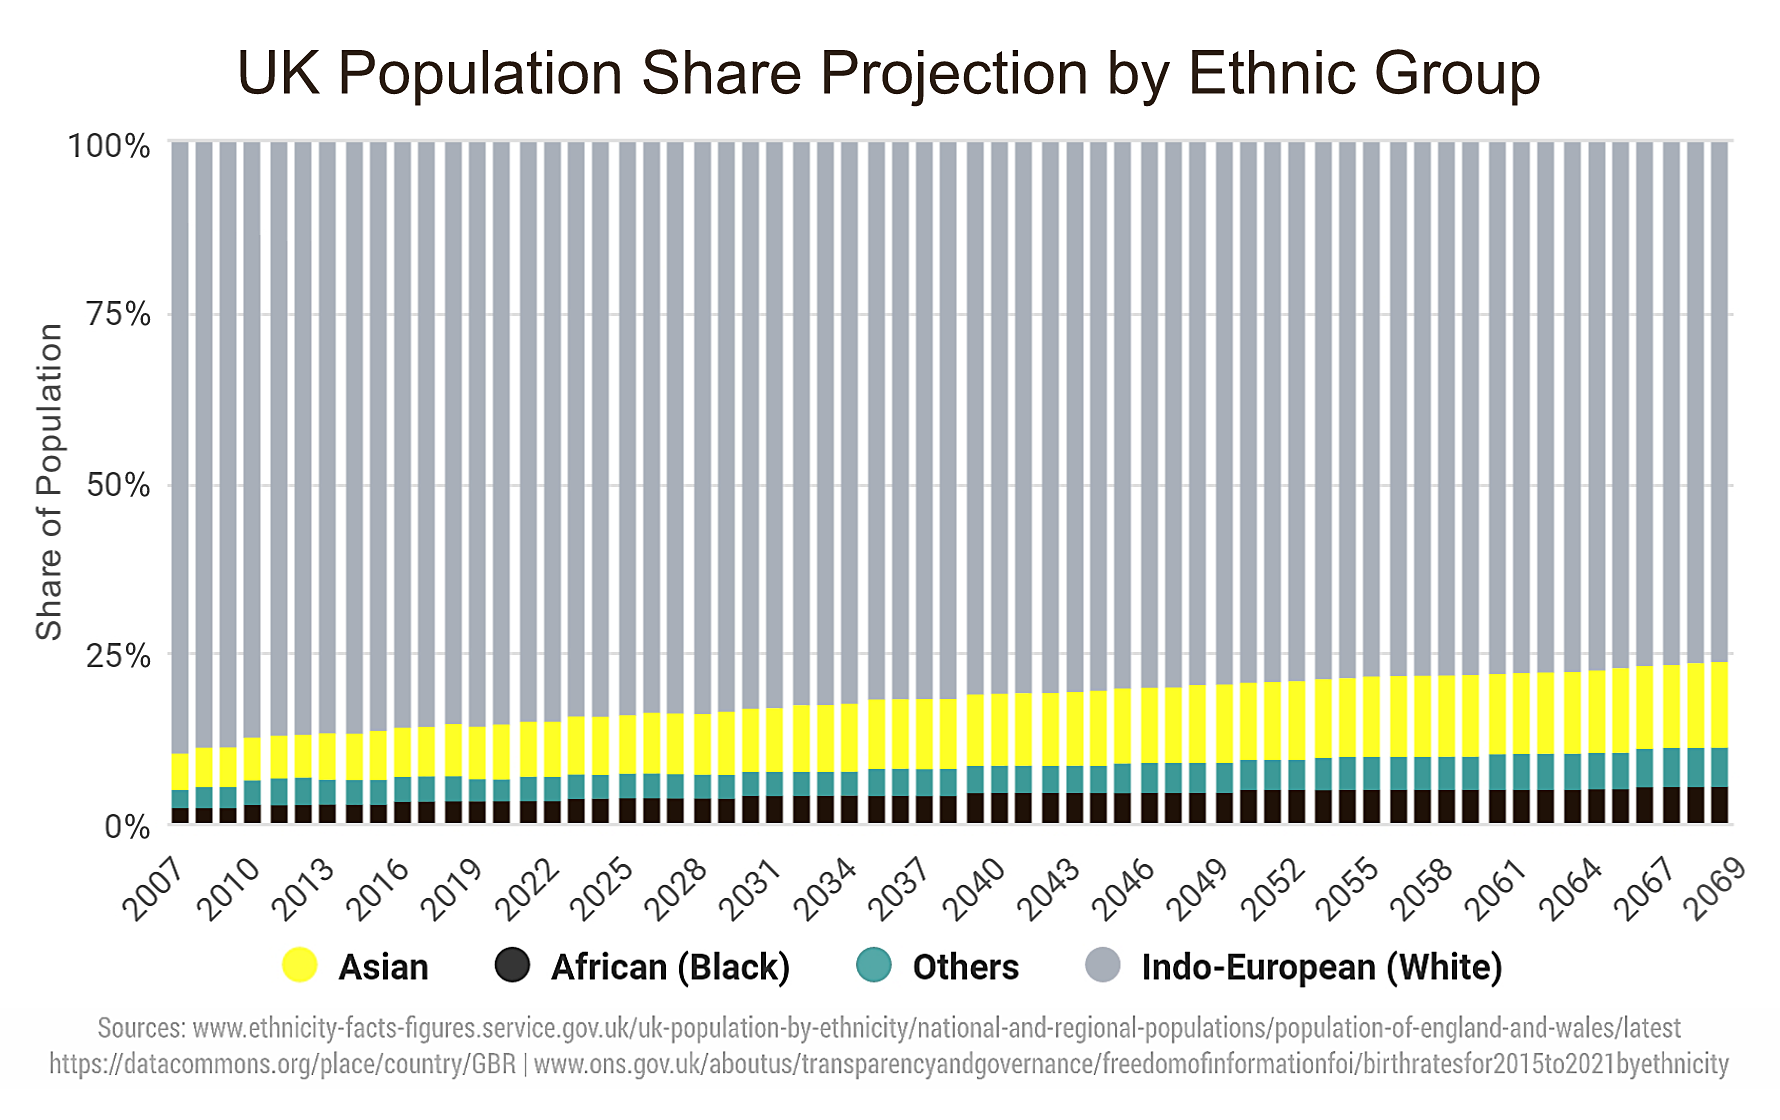
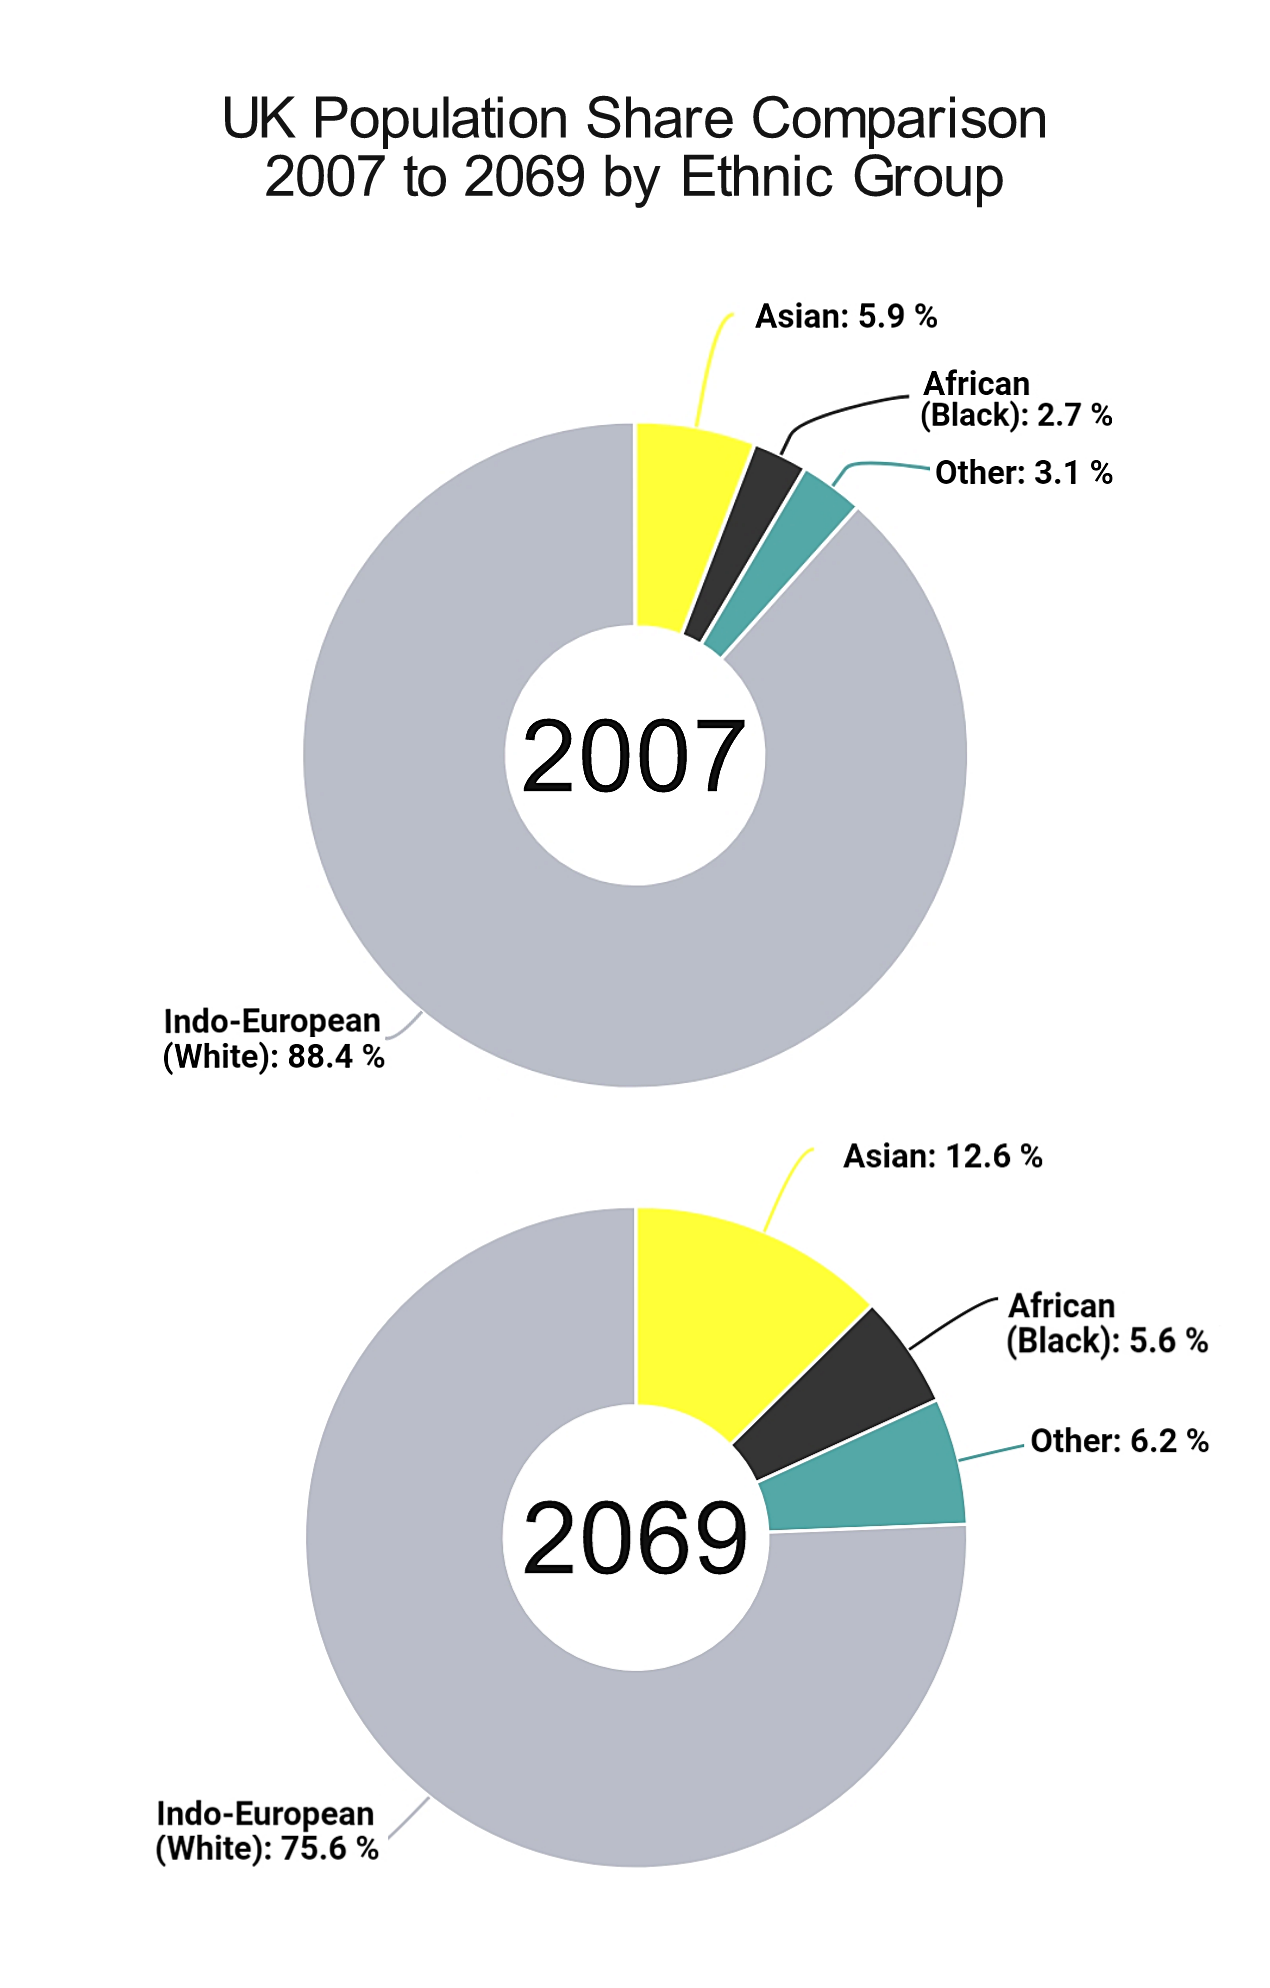
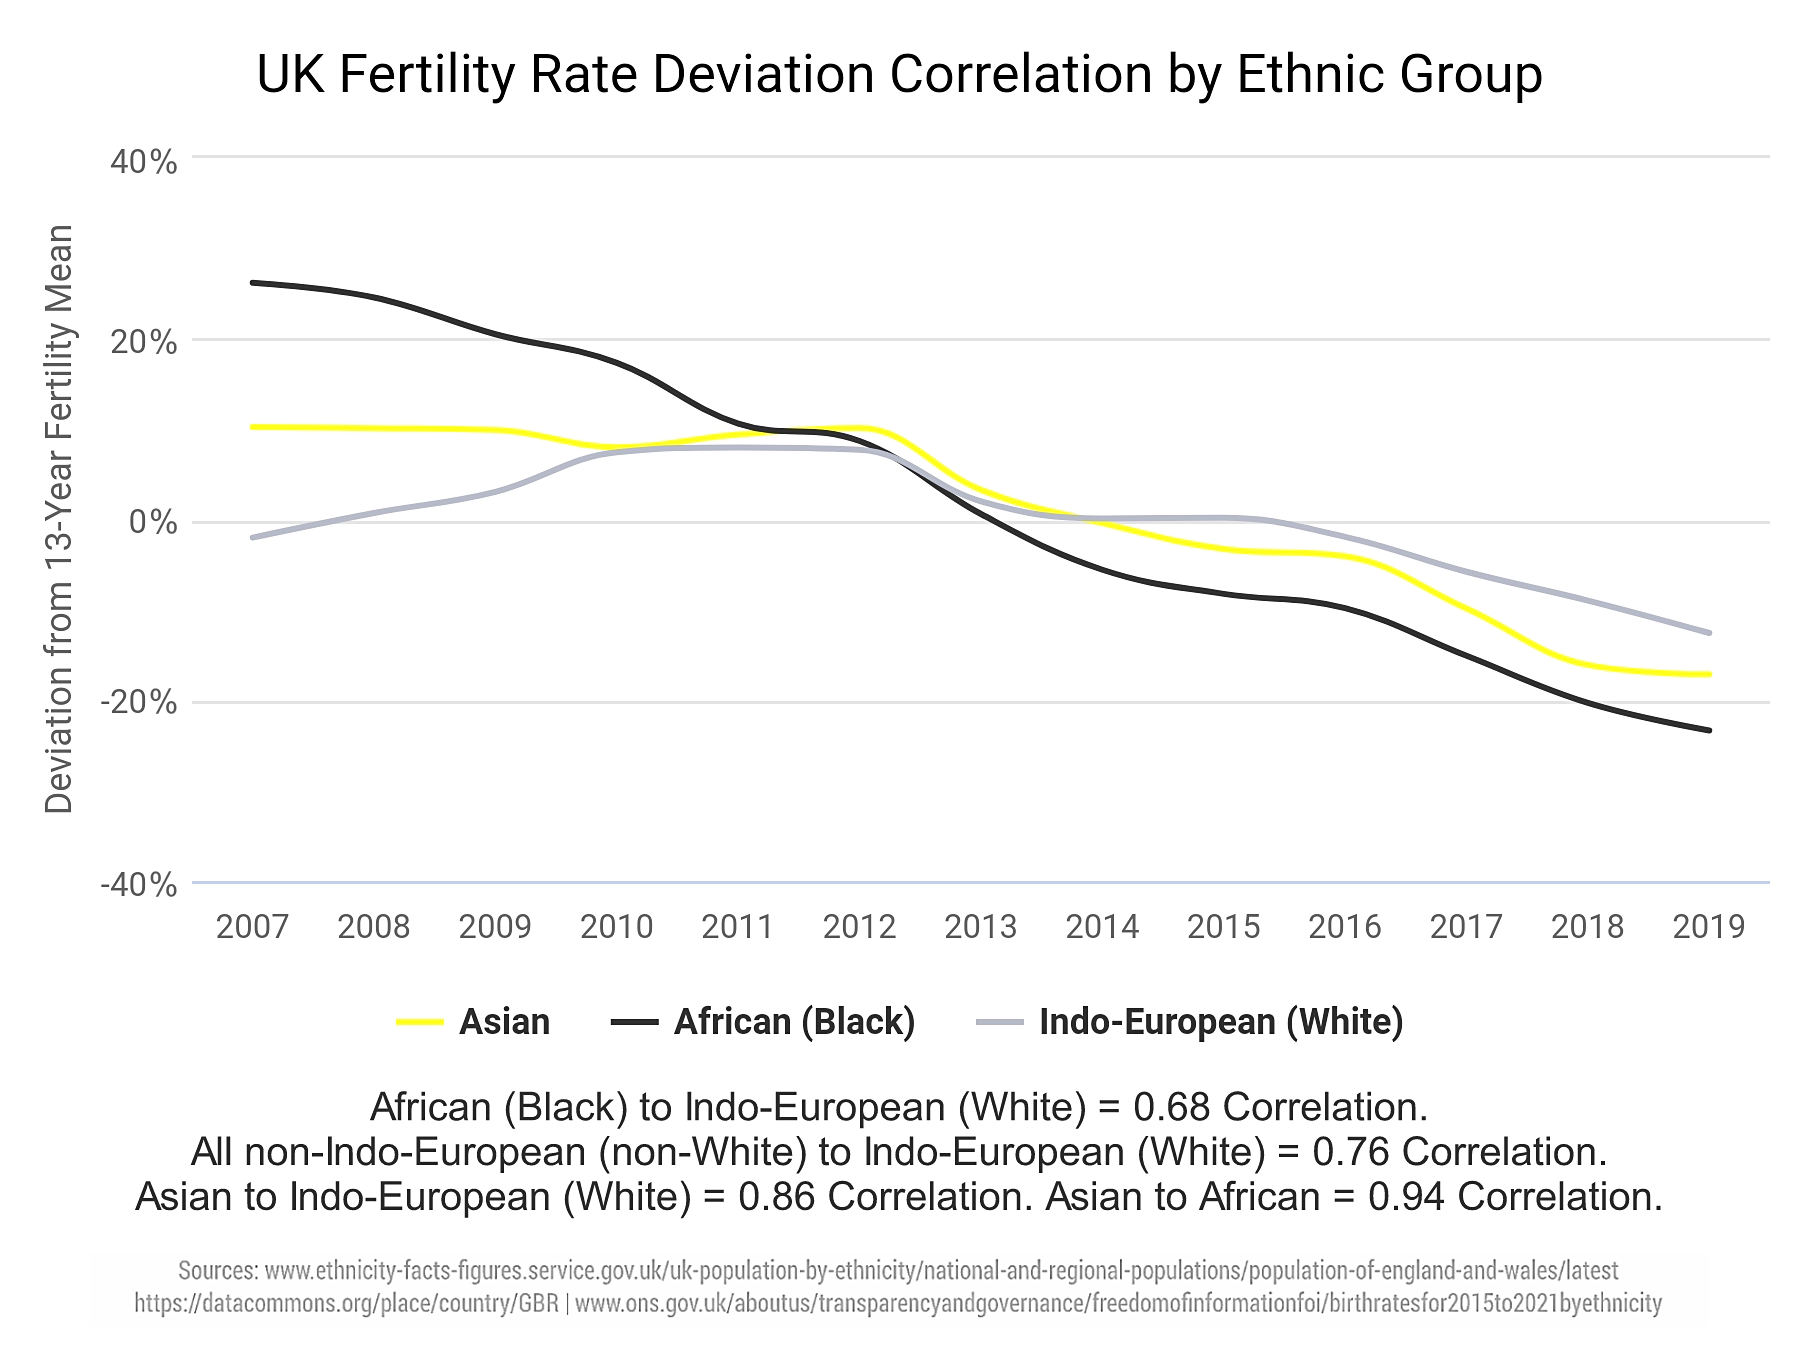
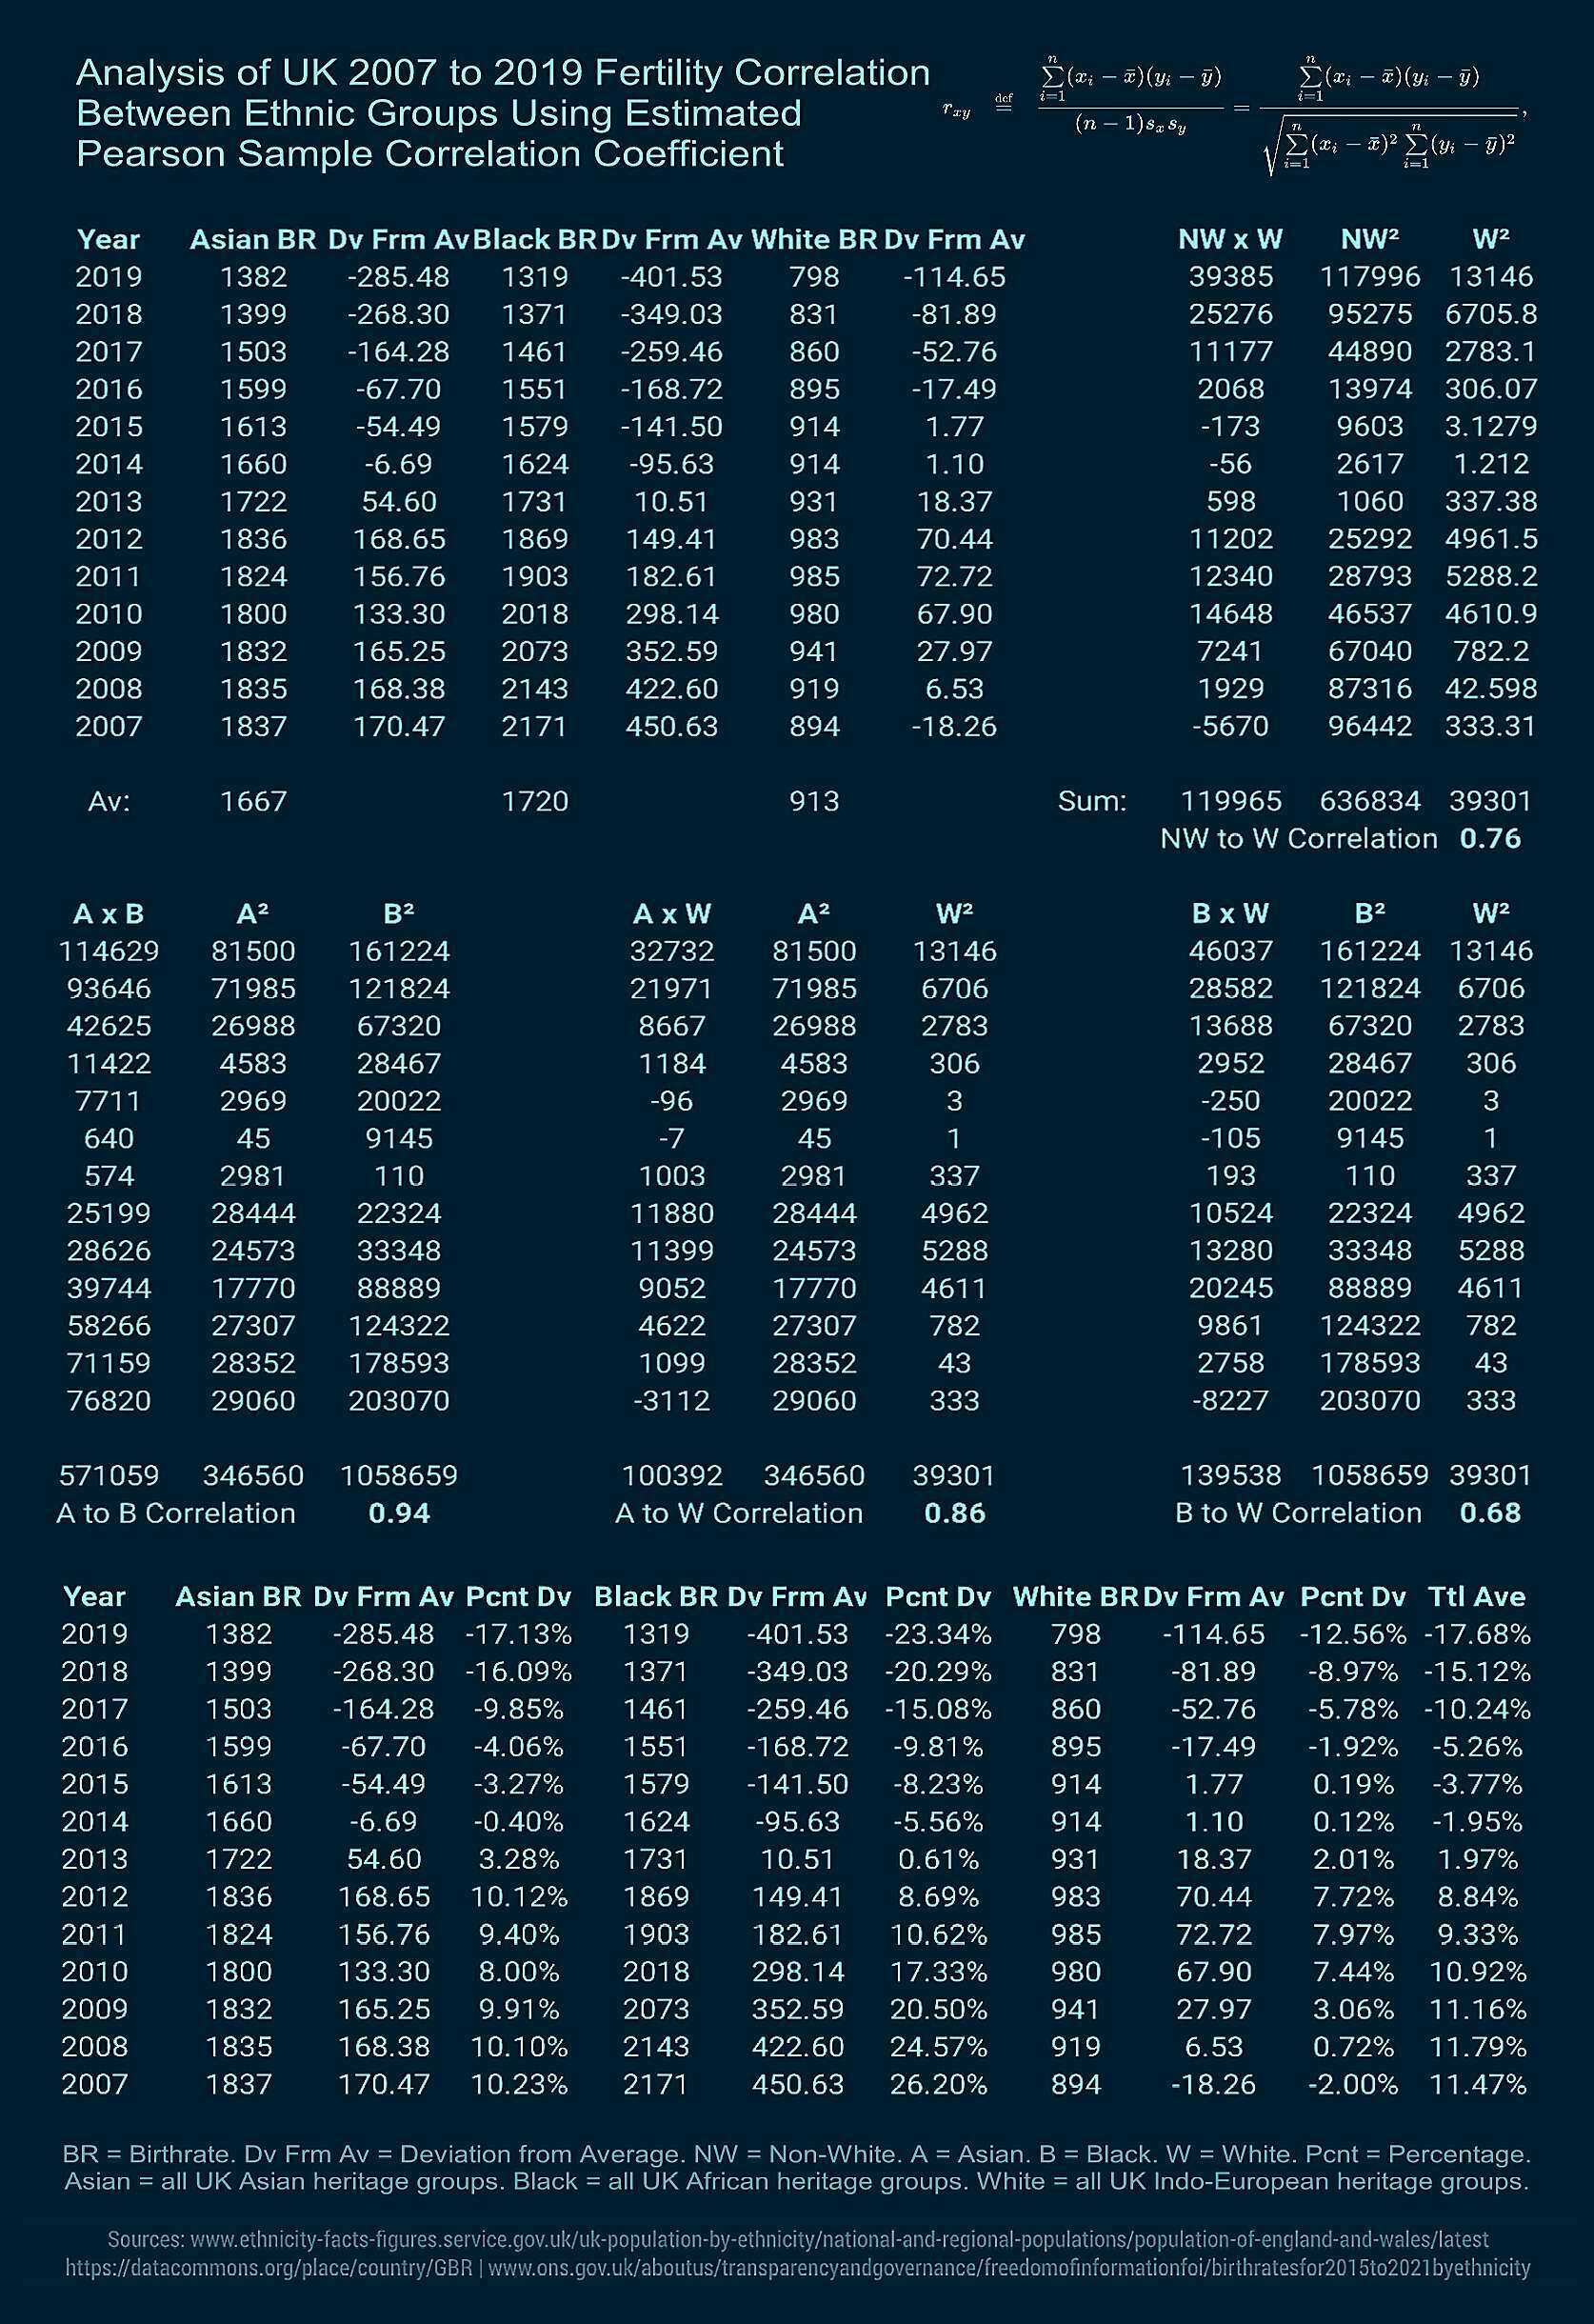
Analysis of UK 2007 to 2019 fertility #correlation between ethnic groups.

Something happens around 2012 that negatively influences all group's fertility, some more than others.

The fact that each ethnic group's fertility rate change is so very highly correlated despite significant differences in geographic distribution suggests to me an external, society-wide influence.

#uk #britain #ukpopulation #ethnicity #demographics #ukdemographics #socialengineering #ethnography #ukethnography #england #white #black #asian #indoeuropean #data #african #multiculturalism #chemical #endocrinedisruptors #analysis #usa #graphs #charts #mathematics #eu #statistics #stats #ukgovernment #britishgovernment #fertilityrates #multiracialism #demography #gb #ethnicgroups #populationdata

tpq1980@iviv.hu

#UK population share by #ethnicity 2007 to 2069, using UK government fertility & #population data 2007 to 2019 & projected to 2069 using linear #growth modified by #population growth #trends derived from the 2007 to 2019 #data.

When did the #British people #vote for demographic change? When was the #referendum? Which party ran on a platform of demographic change & was subsequently #elected to office?

#britain #ukpopulation #info #demographics #ukdemographics #ukethniccomposition #ethnography #ukethnography #england #white #black #asian #indoeuropean #african #multiculturalism #birthrates #demographicchange #analysis #graphs #charts #mathematics #statistics #stats #ukgovernment #britishgovernment #immigration #multiracialism #demography #ethnicgroups #populationdata