2 Likes
#statistics
5 Likes
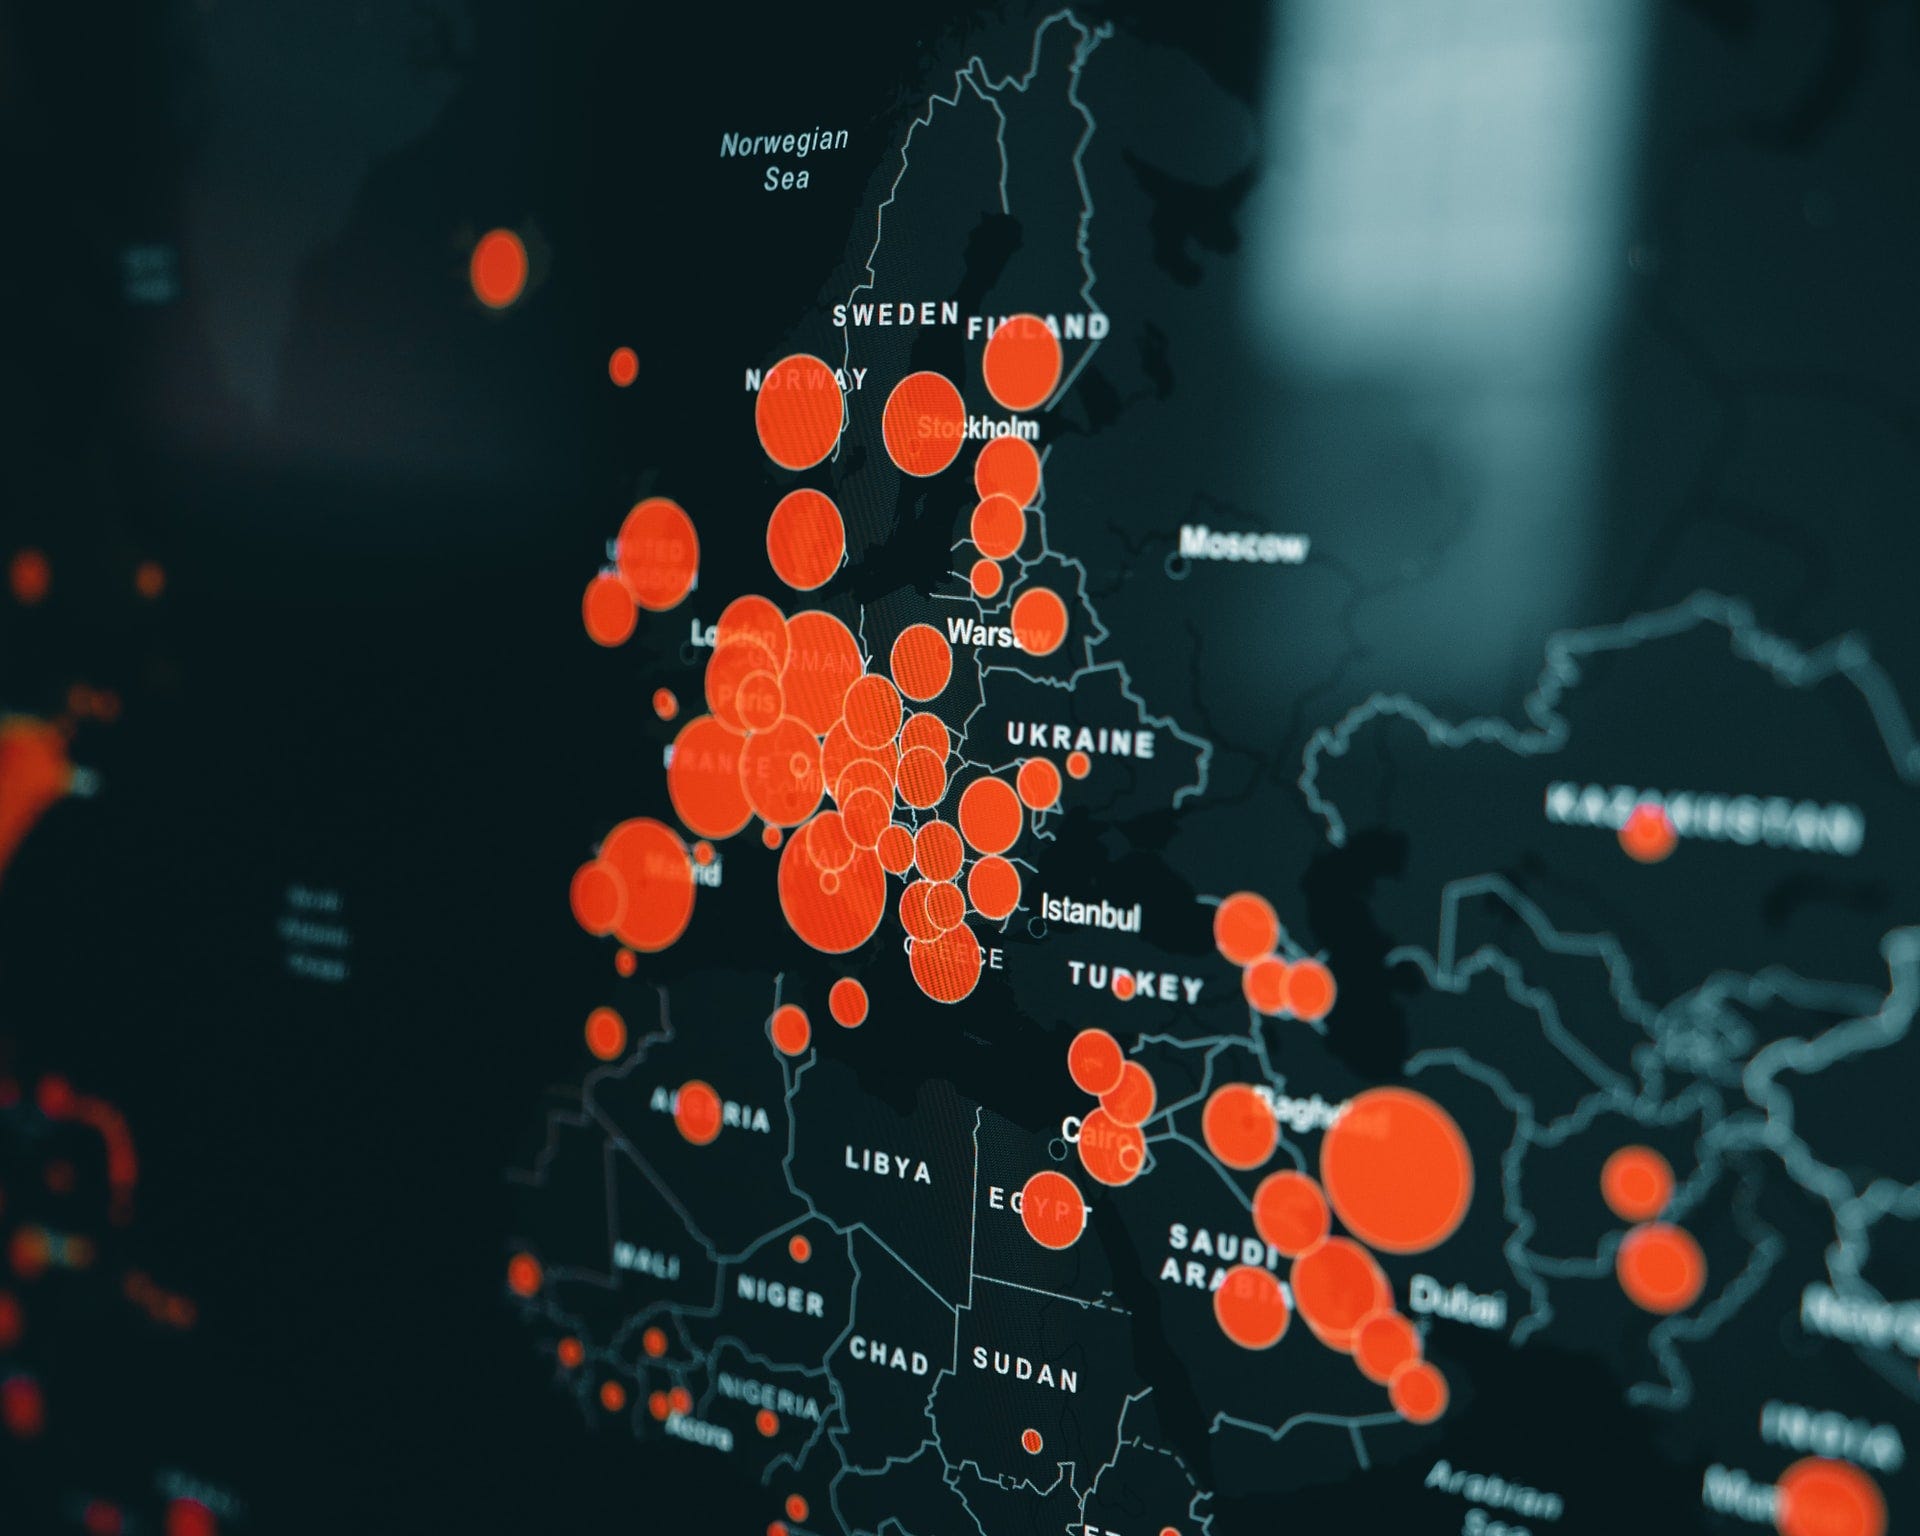
Copernicus: Globally, the seven hottest years on record were the last seven; #carbon #dioxide and #methane concentrations continue to rise
source: https://climate.copernicus.eu/copernicus-globally-seven-hottest-years-record-were-last-seven

Anyone who still claims not to believe in #climate #change is just a hopeless idiot.
#warming #temperature #crisis #earth #environment #nature #future #humanity #science #statistics #problem #news
One person like that
2 Comments
1 Shares
#England and #Wales : Deaths Per Month Charted http://schestowitz.com/Weblog/archives/2022/01/05/deaths-per-month-charted/ #uk #covid19 #statistics
One person like that
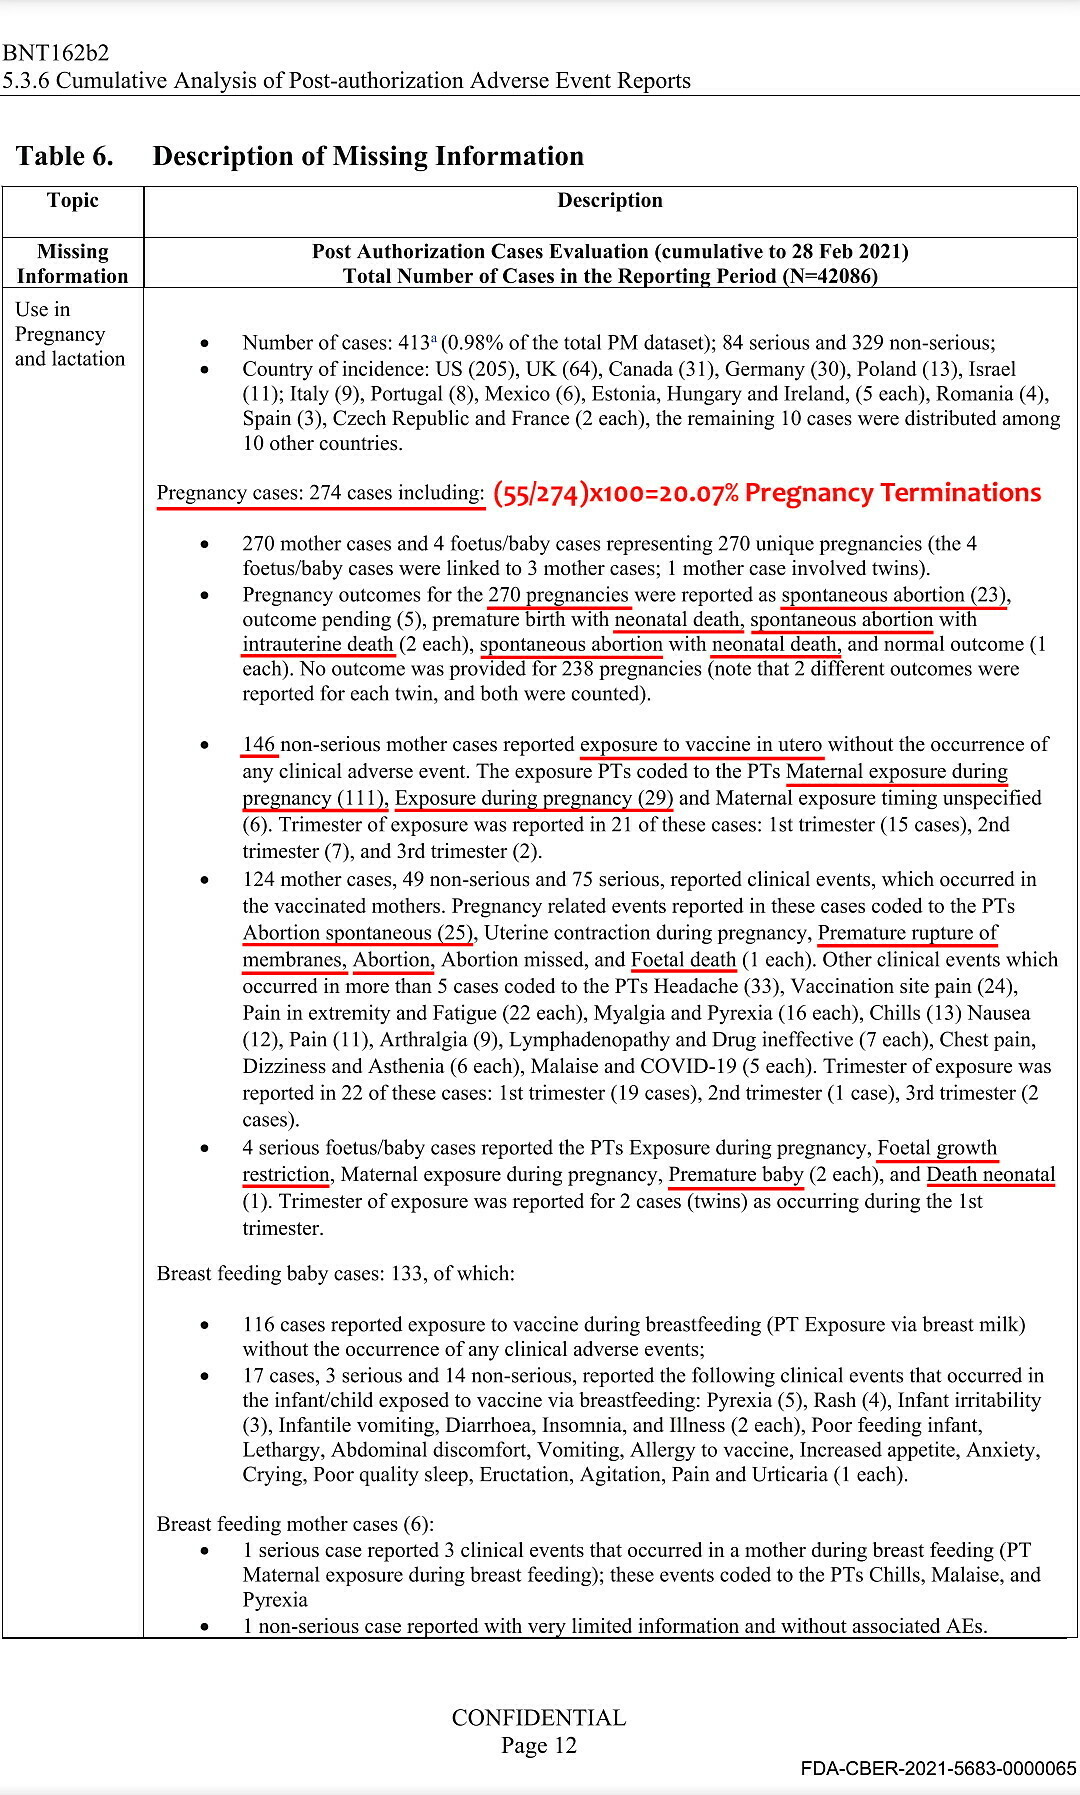
According to Pfizer data reported to the FDA and recently released to the public via FOIA request, 20.07% of pregnancies are terminated as a result of administering the Pfizer mRNA "vaccine" to pregnant women.
Assuming the Pfizer data is authentic, this risk profile means that nobody who is pregnant should take the Pfizer mRNA Covid "vaccine."
5.3.6 Cumulative Analysis of post-Authorization Adverse Event Reports of PF-07302048 (BNT162B2) Received Through 28-FEB-2021
#pfizer #pfizervaccine #fda #foia #pregnancy #pregnant #abortion #USA #UK #baby #babies #children #child #vaccines #vaccination #mrna #vaccine #albertbourla #billgates #covid #covid19 #coronavirus #risk #women #female #woman #fertility #data #statistics #report #study
One person like that
1 Comments
2 Shares
this shit is hilarious as it basically reveals how the GLOBAL stats from MEDIA and GOVERNMENT on "VACCINATED" people .. is actually HUGELY over inflated..
maybe you can look for the same kind of evidence .. in your country ?
this article states that .. 2,744,974 people participated in the "VACCINE LOTTERY" .. which means either 80% of those vaccinated DIDNT want to win 1 MILLION DOLLARS.. or the number of actual vaccinated people are the INVERSE of what is stated .. (90%).. when this vaccine lottery participation figures shows its actually 10% lol
#covid #statistics #lies #propaganda #inflated #vaccination #numbers
Annual EU solar PV deployment reaches new high of 25.9GW
The European Union’s (EU) solar PV sector has navigated a year beset by supply chain disruptions and module prices hikes to post record levels of annual deployment, according to research from SolarPower Europe (SPE).
https://www.pv-tech.org/annual-eu-solar-pv-deployment-reaches-new-high-of-25-9gw/
#denmark, #france, #deployment, #european, #germany, #statistics, #union, #hungary, #news
One person like that
2 Likes
1 Comments
1 Shares
According to the FDA FOIA data, the Pfizer "vaccine" has a (1223/42086)x100=2.91% fatality rate. According to data from Cambridge university, the mortality rate of Covid in the UK including all ages is (1/480)x100=0.208%. Overall, that makes the "vaccine" 14x (1400%) more deadly than Covid overall.
It doesn't stop there though, as according to Cambridge the younger a person is, the lower their Covid mortality rate is.
Under 25s = (1/91,775)x100=0.001% mortality rate.
25-44 = (1/7405)x100=0.014% mortality rate.
45-64 = (1/934)x100=0.107% mortality rate.
65-74 = (1/249)x100=0.401% mortality rate.
75+ = (1/50)x100=2.000% mortality rate.
So, the Pfizer "vaccine" is:
2,910x (291,000%) more deadly than Covid for those under 25.
208x (20,800%) more deadly than Covid for those 25-44.
27x (2,700%) more deadly than Covid for those 45-64.
7.3x (730%) more deadly than Covid for those 65-74.
1.5x (150%) more deadly than Covid for those over 75.
https://www.bitchute.com/video/5RDfc2FXhfIo/
https://iviv.hu/posts/ad5ea0801c82013a10e7723c915ba918
#fda #vaccine #vaccines #pfizer #covid #covid19 #cdc #foia #data #statistics #cambridge #adversereactions #vaccinedeaths #vaccineinjuries #bigpharma #corruption #cronycapitalists #psyop #ccp #westerncivilization #uk #usa #fauci #albertbourla
One person like that
2 Comments
COVID-19: The Trouble With the Case Curve During the Holidays
The familiar curve chart that shows new Covid-19 cases will be disrupted by testing and data reporting interruptions just as people prepare for another holiday season in the United States. Last year, the national case curve showed pronounced declines after Thanksgiving and Christmas that did not reflect real decreases in new infections.
The impact of holidays may be even more noticeable this time around, as illustrated by the recent Labor Day holiday, because states are reporting data less consistently than they did a year ago. In response, we’re updating the averaging methodology that turns the daily case and death data we report into a curve chart. ...
...
The average number of cases reported each day declined after both Thanksgiving and Christmas, but these drops corresponded to decreases in the number of tests performed, meaning that more cases were likely going uncounted. Once tests returned to previous levels, cases quickly climbed again to their peak in early January. Those deceiving decreases were not reflected in the chart showing the number of people hospitalized with Covid-19 during the holiday season.
The number of people hospitalized with Covid is a lagging indicator of community infection rates, but is less sensitive to holiday data interruptions because data from hospitals is reported directly to the Department of Health and Human Services. And if a hospital fails to report for a single day, the same number of Covid-19 patients from the previous day can be easily carried forward. ...
I've pointed out the distortionary effects of holiday dates on COVID-19 (and other healthcare and epidemiological) reporting previously. That's occasionally been met by some strong pushback by those insisting that the changes in reported data reflect actual incidence fluctuations.
The simple truth is that they do not, that the same fluctuations appear across numerous data series ... and are curiously absent from others. As the New York Times article notes, the pronounced "notches" which appear at Thanksgiving and Christmas in US data (and smaller notches appearing at Memorial Day, Independence Day, and Labour day, all large US national holidays often coinciding with travel) are not reflected by fluctuations in hospital admissions, which are both a lagging and more persistent trend.
I'd first noticed this about two decades ago in an earlier life doing health care data anlysis. I'd been tasked with making sense of a set of outpatient data for a clinic --- mostly dealing with minor or routine issues. The daily-level data were quite noisy, and what I quickly learnt applying different smoothing intervals was that at a weekly level virtually all of the daily "noise" disappeared, though what remained was a pronounced 7-day trend with large drops on weekends. This pattern also persisted when longer multiples-of-seven smoothing periods were applied: 14, 21, and 28 days. I (and most official data analyses) tend to stick with the shortest useful smoothing period, though for smaller countries with thinner data, I often wish that a longer (2--4 week) smoothing period would be applied as data over shorter periods remain quite noisy and give the spurious appearance of real changes which are not in fact warranted..
The other strongly evident pattern was that claims dropped precipitously on and around holidays, with the largest declines appearing at Thanksgiving and Christmas for US data. This was evident across several years' worth of data. And so when I started looking at COVID19 data, the holiday dips stood out to me as they occurred, first with a late-May dip (Memorial Day, US), then the 4th of July (Independence day), Labour Day, and of course the larger Thanksgiving and Christmas / New Years dips (there's a trend that flows through the period from the 25th of December through the 1st of January).
And now the New York Times seem to have recognised this.
You'll find similar patterns for data in other countries, of course. In Canada, Canada Day (July 1), Labour Day (Sept. 6), and Thanksgiving (October 12) are visible, along with the much more pronounced Christmas holiday:
https://www.worldometers.info/coronavirus/country/canada/
In Germany, Easter Week shows a major dip:
https://www.worldometers.info/coronavirus/country/germany
Again, what characterises a holiday data reporting dip is:
- A fall in reported data that are themselves based on direct and often voluntary assessment or filing times. Covid tests and (in many countries) coronors' reports if based on filing date rather than date of death will follow these trends. Hospital admissions rather less so as these facilities both remain operational and are accessed when truly needed.
- A resumption of an earlier trendline. You can usually imagine a consistent smoothed line running through the time period.
- An absence of a sharp exponential growth trend. Again, where there are triggering events leading to outbreaks, what is not seen is a sudden spike in cases, but a slow growth following a doubling trend. As has been observed, "Exponential growth doesn't mean 'fast', it means 'imperceptibly at first, then suddenly overwhelming'." A holiday-induced outbreak would look much more like South Dakota following the 2020 Sturgis Rally (~8--19 August, 2020), with a slow rise appearing by the 23d, and a sharp climb from the 25 of August through September 3. Cases subsequently fell, but began rising again after the 14th of September, and continued to climb until their November 15 peak. For South Dakota in 2020, both the Thanksgiving and Christmas notches appear as the overall case rate was falling rapidly.
https://www.worldometers.info/coronavirus/usa/south-dakota/
https://www.nytimes.com/interactive/2021/11/22/us/covid-data-holiday-averages.html
#COVID19 #epidemiology #pandemics #thanksgiving #christmas #statistics
6 Likes
1 Comments
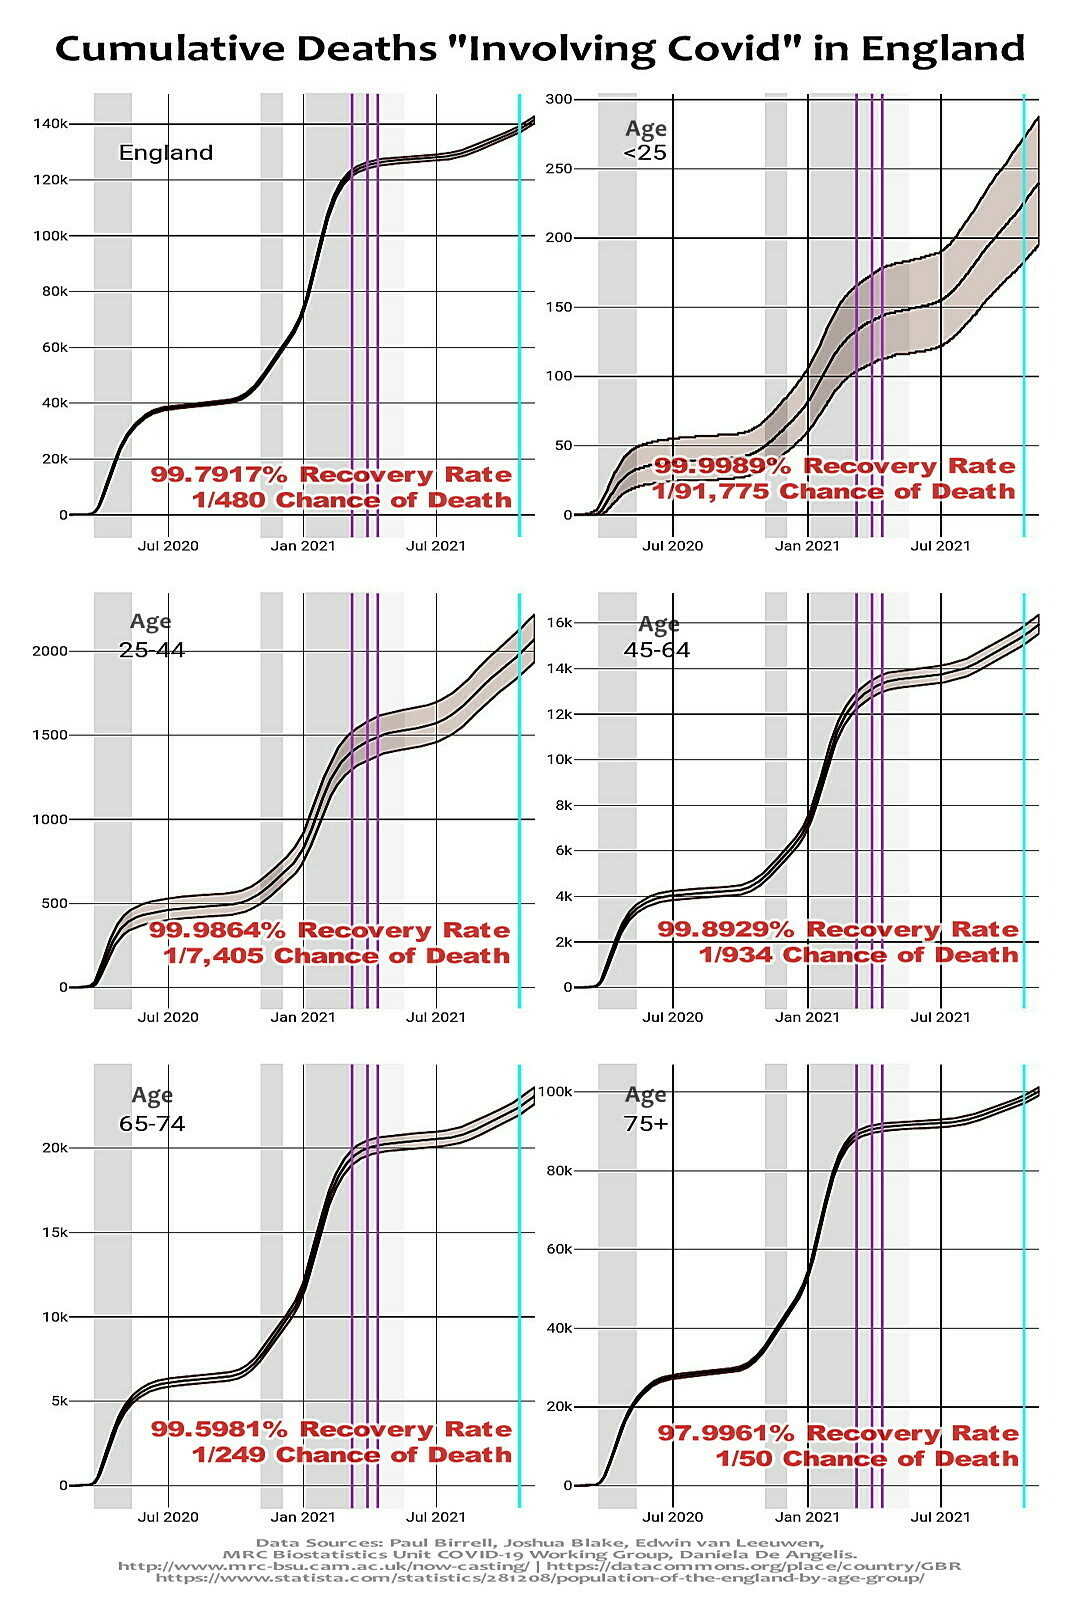
Snapshot of data from Cambridge University tracking the death rate attributed to Covid-19 in England from July 2020 to July 2021, with added percentage recovery rates & probabilities of death based on this & the population of each age group.
#covid #covid19 #coronavirus #UK #ukdata #ukdatareveals #statistics #biostatistics #mrcbiostatisticsunit #cambridge #covidstatistics #mrna #mrnavaccines #information #graphs #charts #data #analysis #deathrate #deathbyagegroup #probability #recoveryrate #plandemic #ade #antibodydependentenhancement
1 Comments
India deployed 8.8GW of solar in 2021 so far, up 280% on last year
India installed around 8,811MW of solar between January and September 2021, a 280% increase on the same period of 2020, according to JMK Research & Analytics.
https://www.pv-tech.org/india-deployed-8-8gw-of-solar-in-2021-so-far-up-280-on-last-year/
#deployment, #statistics, #target, #covid-19, #india, #gujarat, #news, #jmk
One person like that
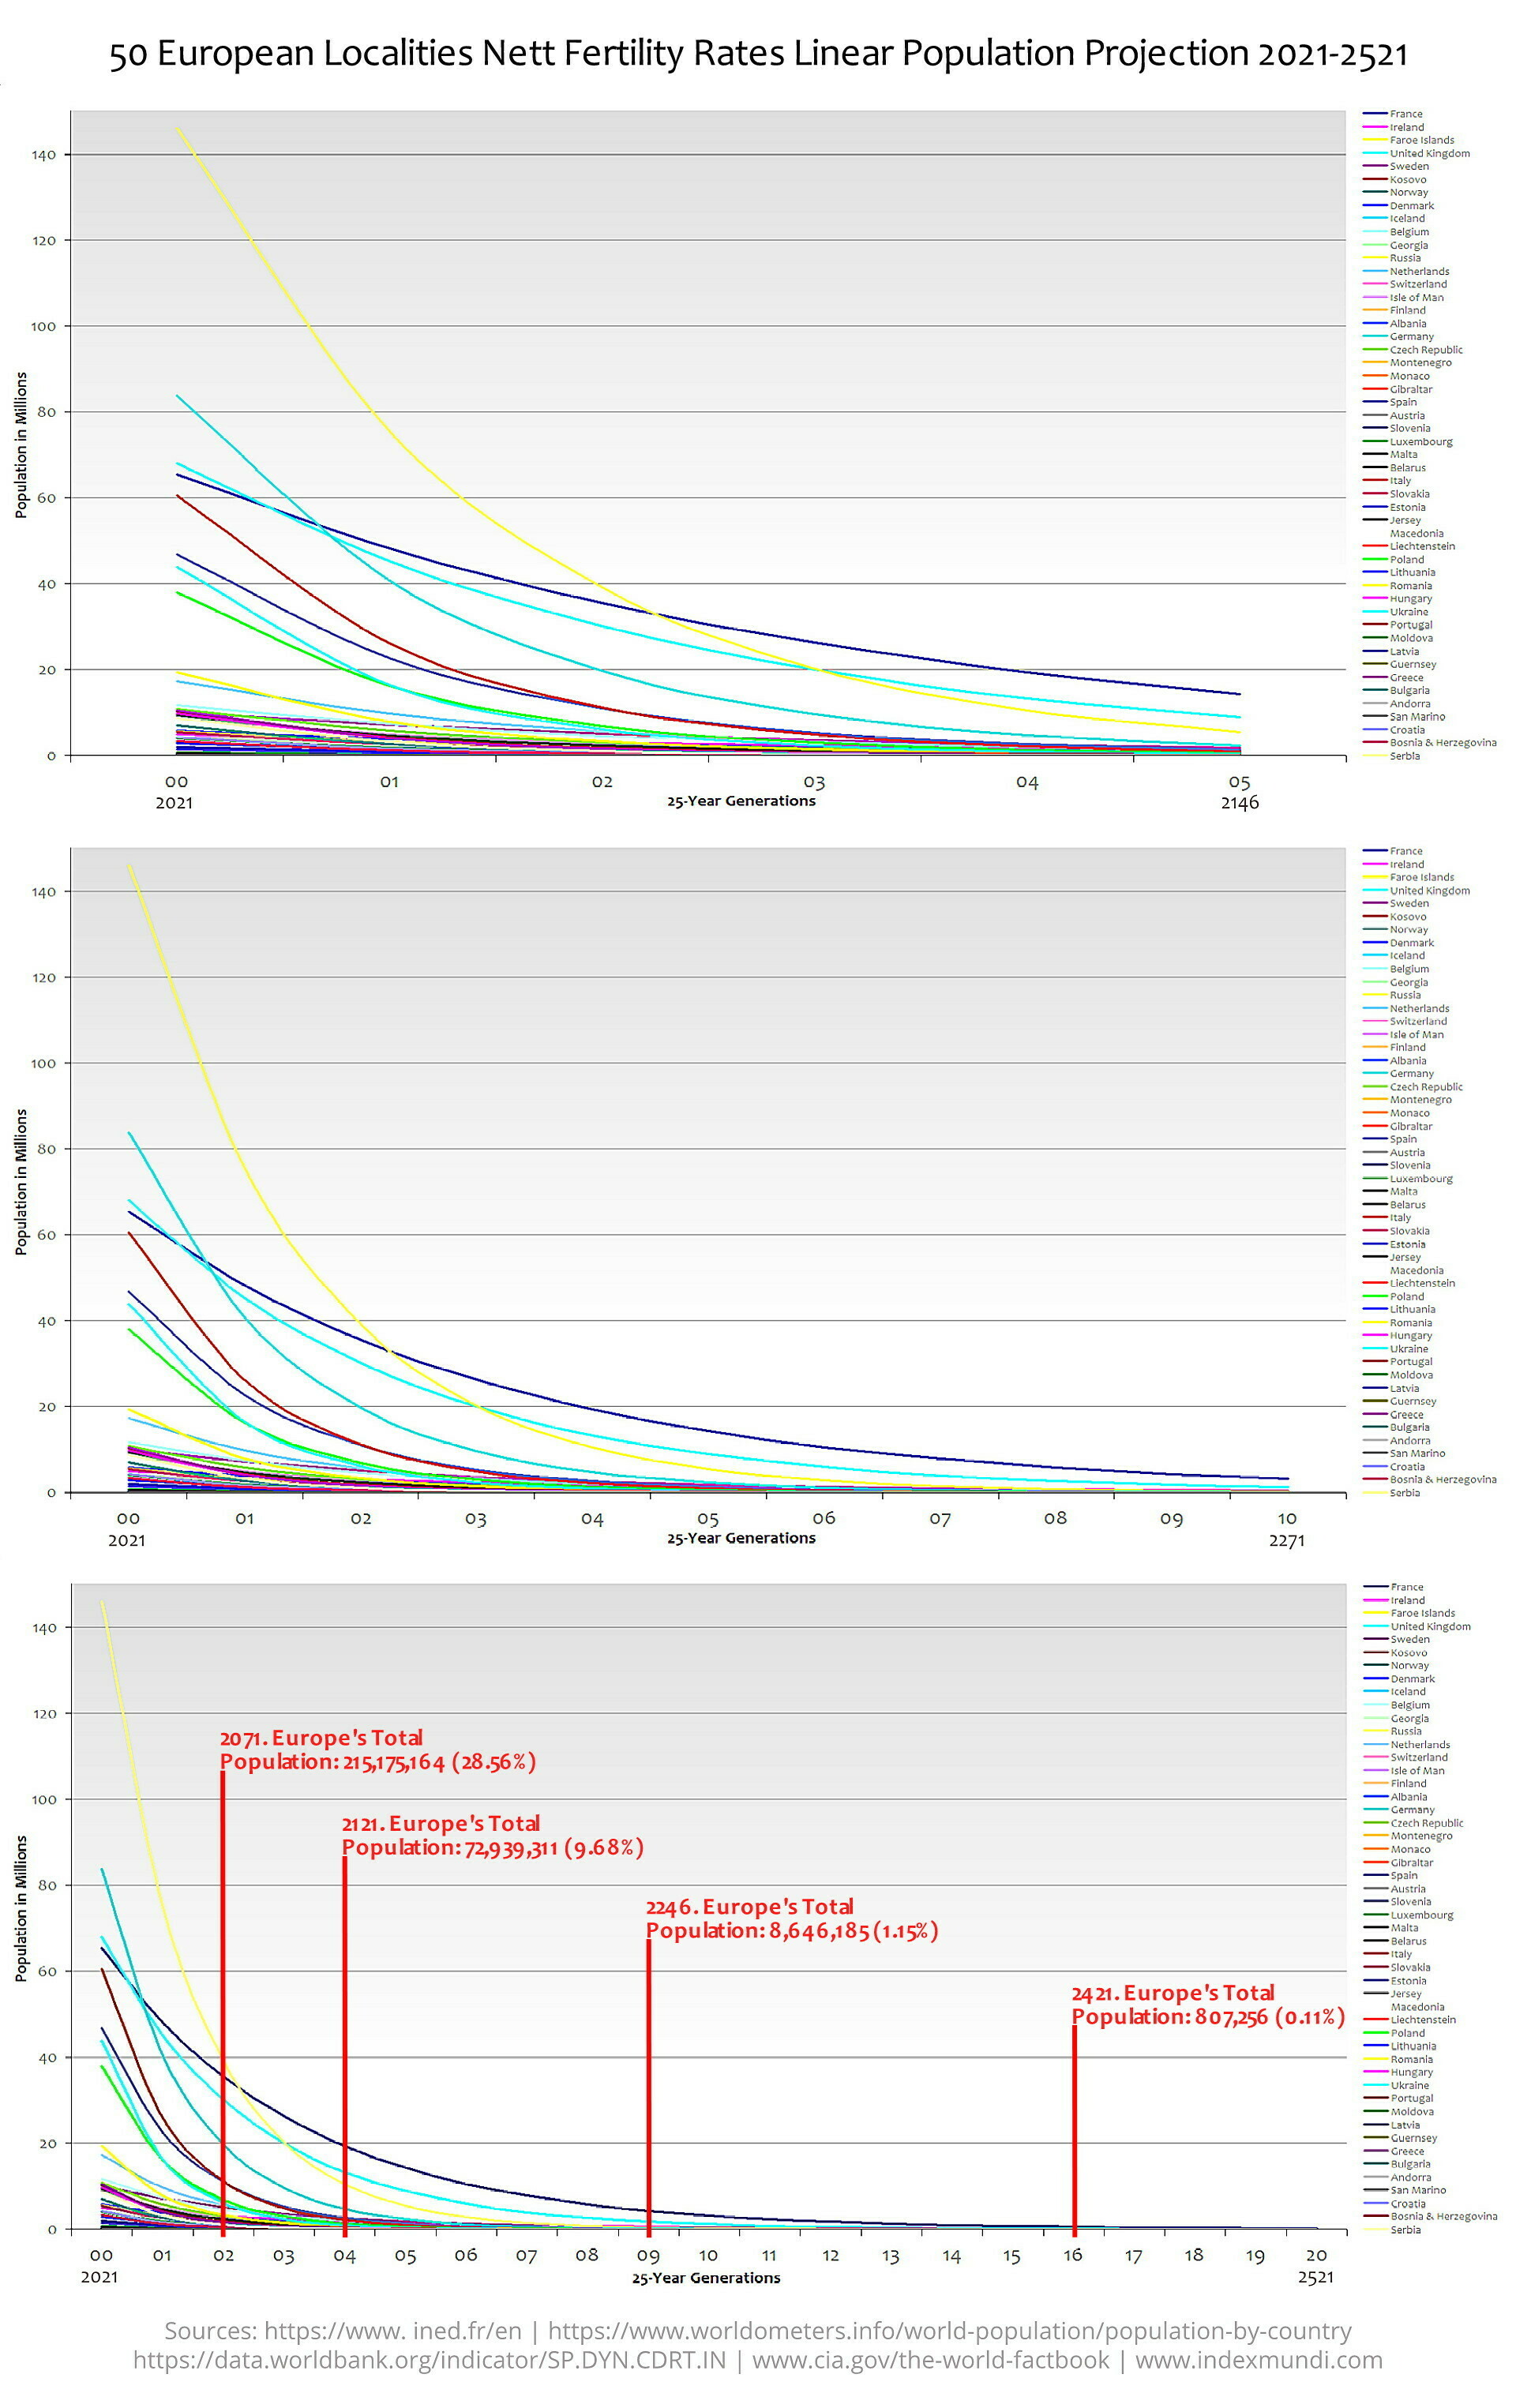
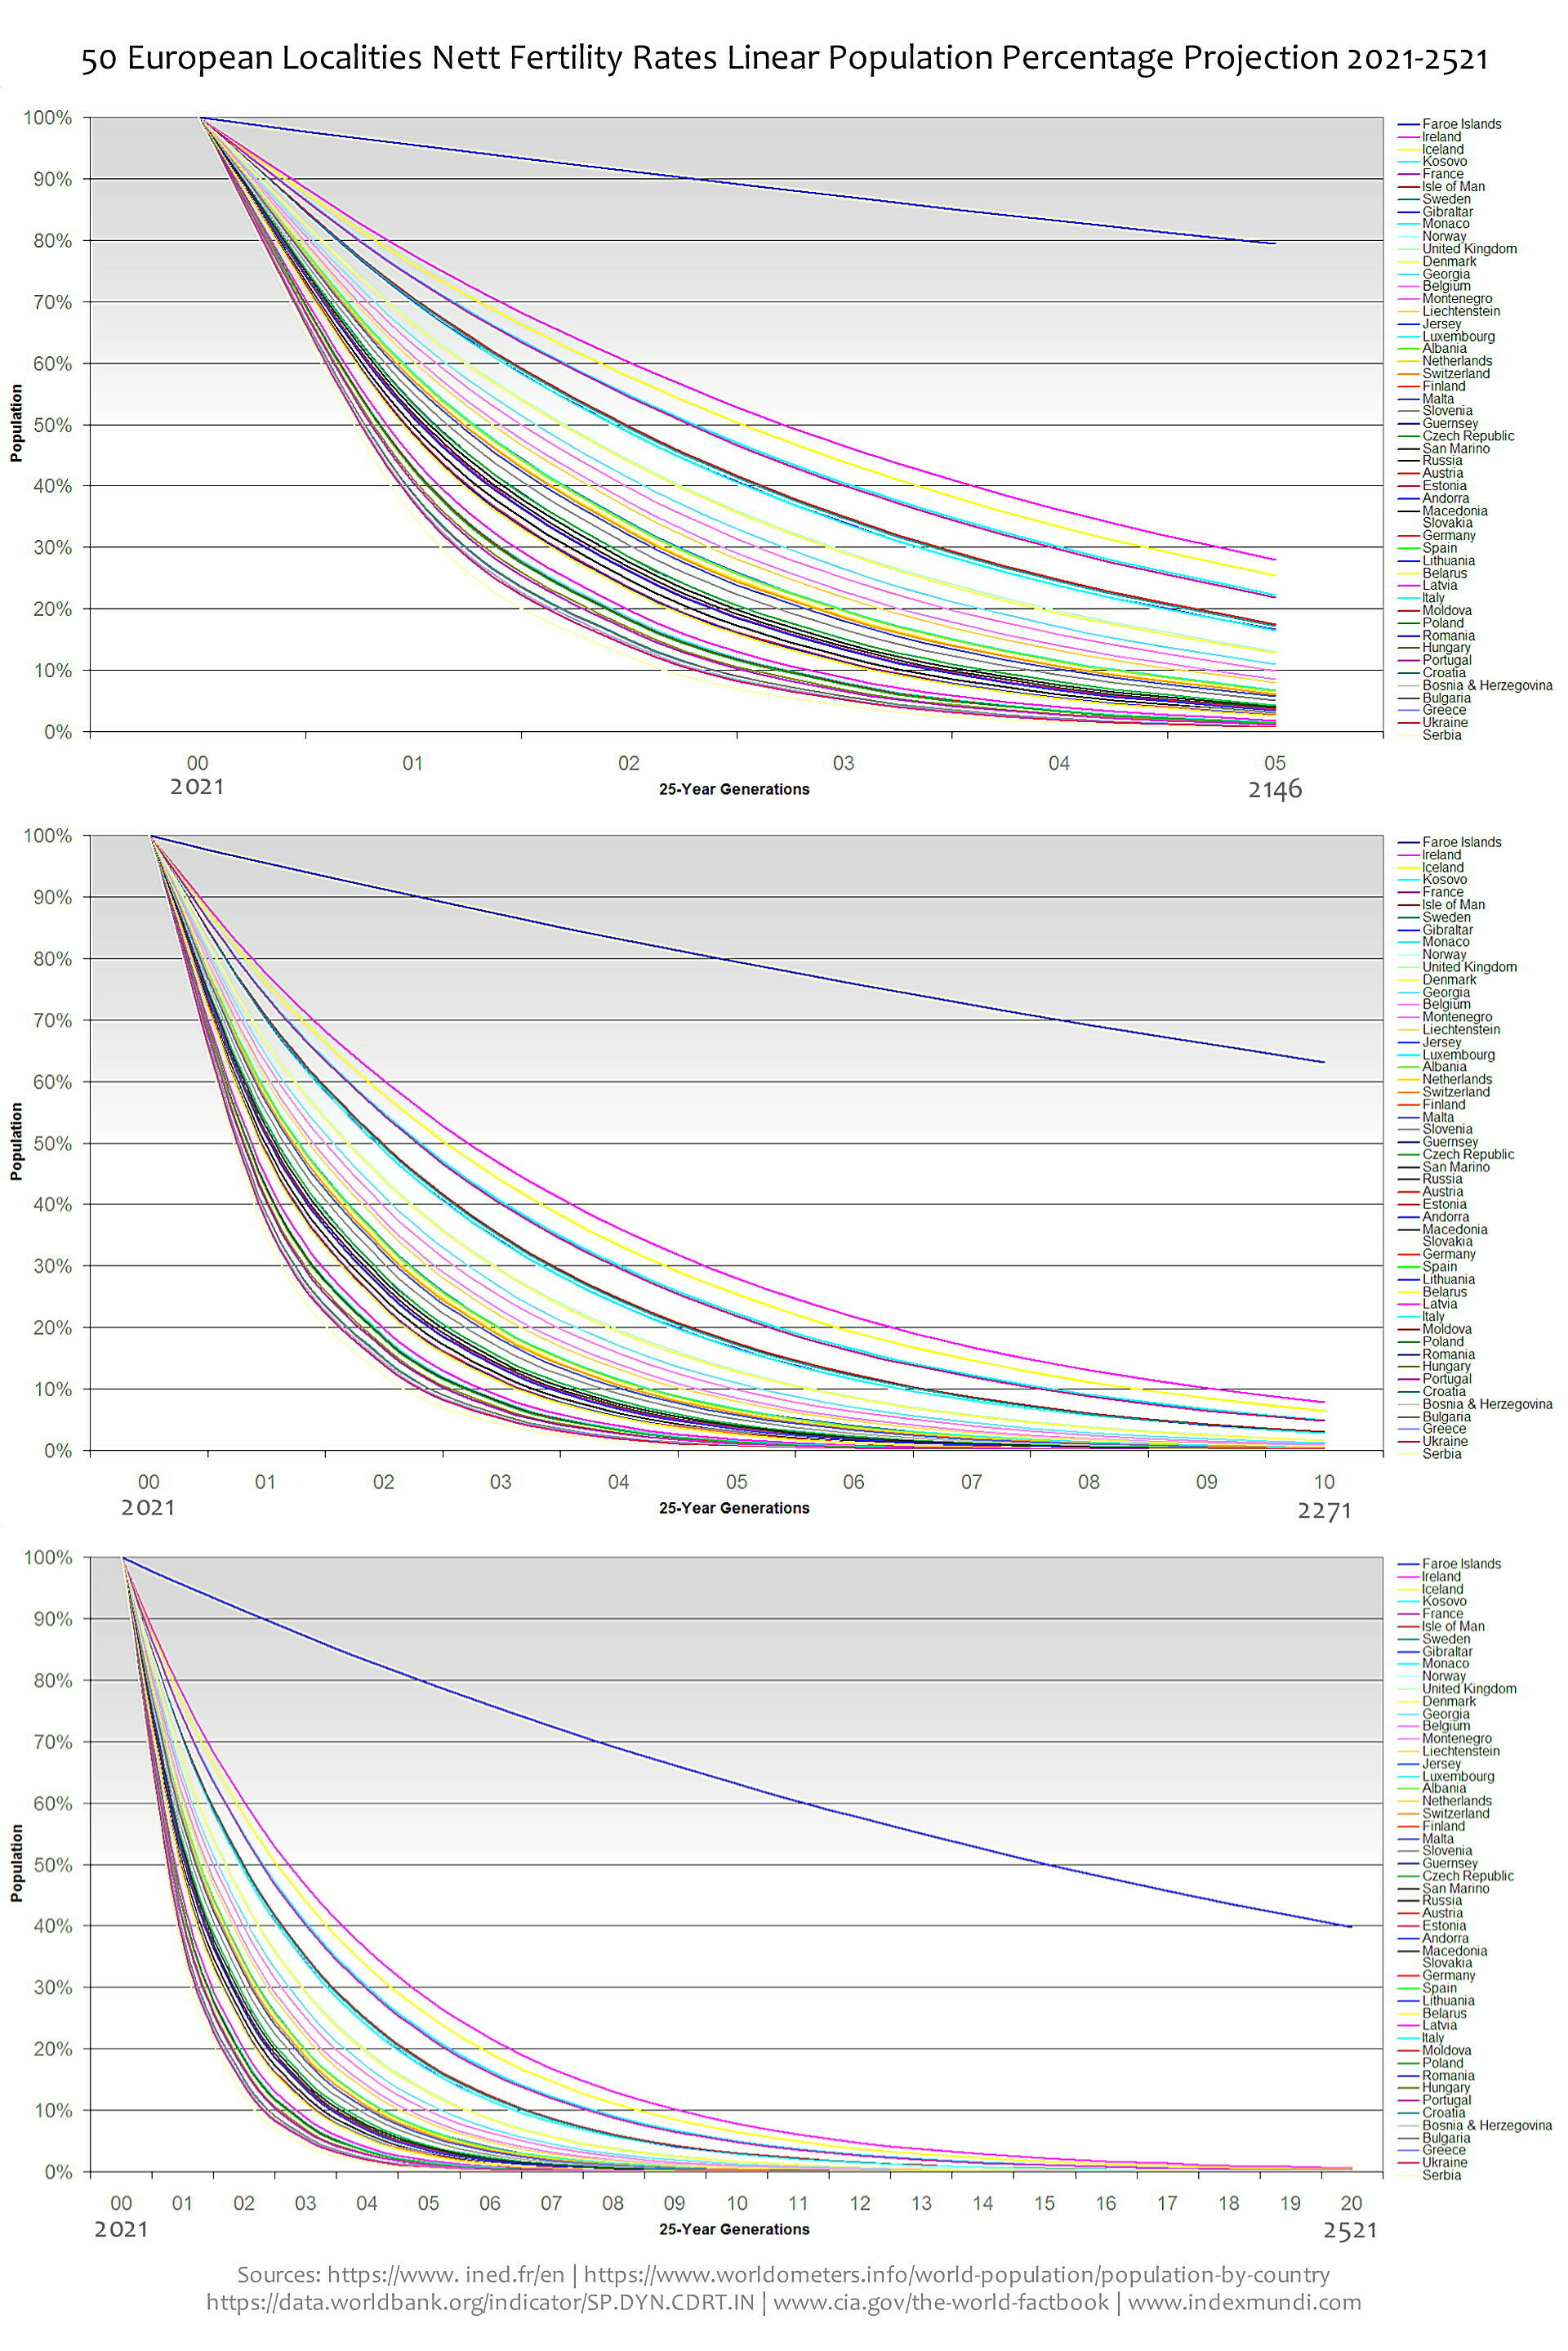
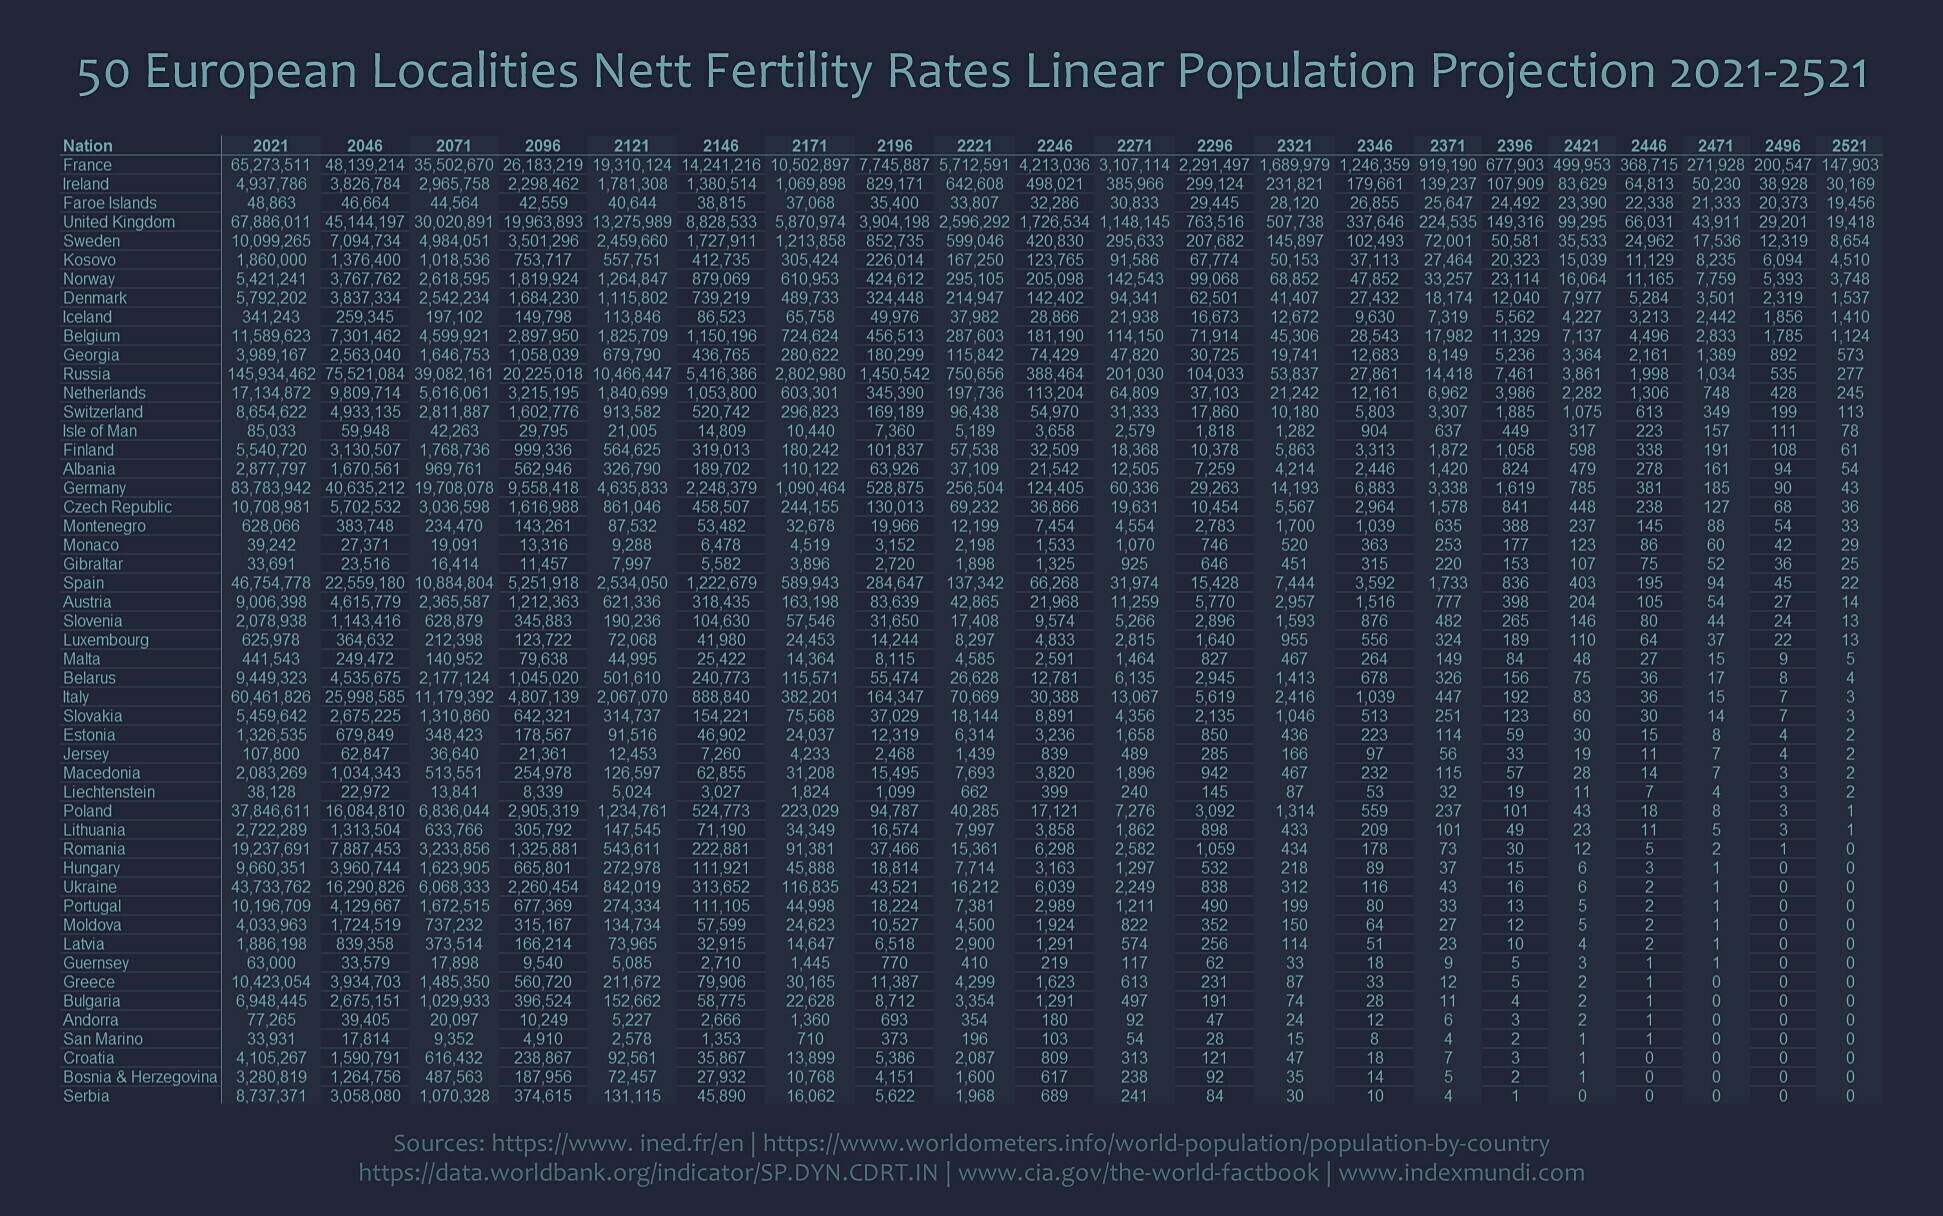
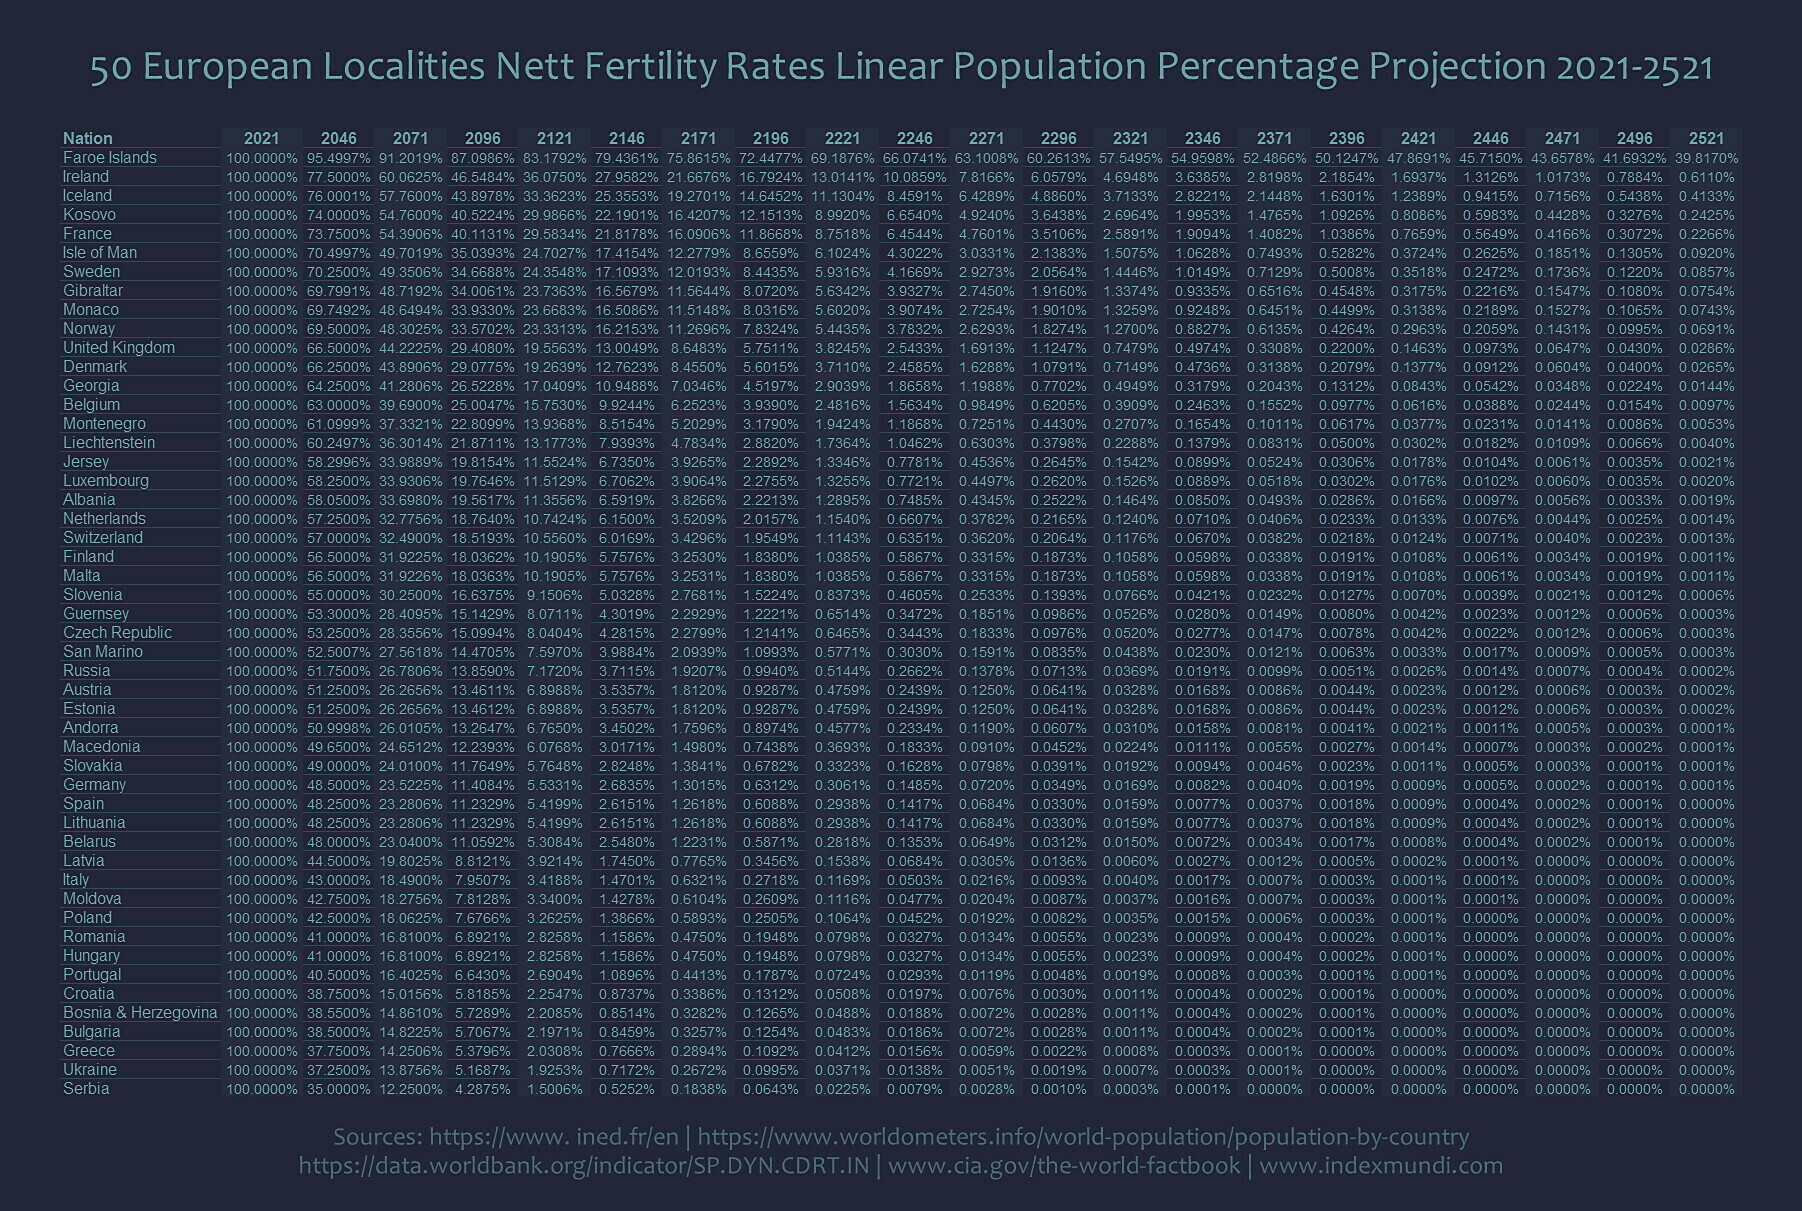
Population projections for 50 European localities based upon current European nett fertility rates.
If you can't see the details clearly, please zoom in, or otherwise download and zoom in on your device.
#population #populationcontrol #birth #birthcontrol #births #fertility #fertilityrate #birthrate #birthrates #populationreduction #projection #populationreplacement #europe #europeans #indoeuropean #white #whitepeople #protoindoeuropean #extinction #family #reproduction #reproductiverights #procreation #baby #babies #children #offspring #replacementmigration #globalism #globalists #neoliberalism #elitism #elites #puppetpoliticians #statistics #stats #probability #charts #graphs #data #information #mathematics
One person like that
41 Comments
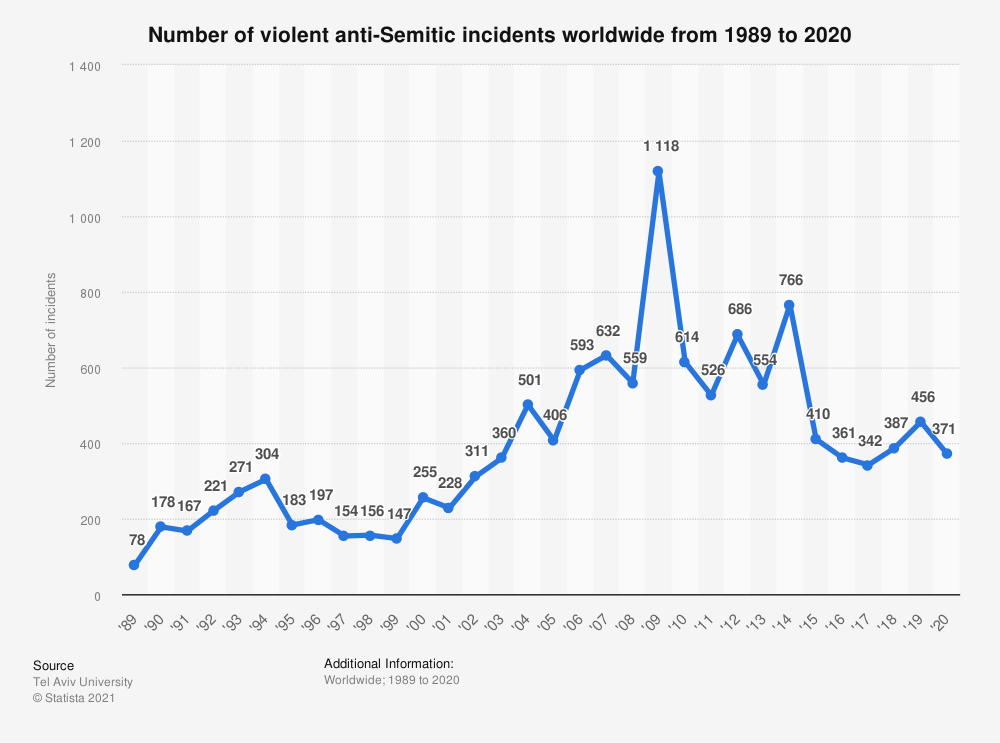
I just wanted to try to #contextualise the notion of "antisemitism", so people who are concerned about it can understand the #phenomenon more accurately.
According to #statistics published by Tel Aviv #University, #violent anti-Semitic attacks are #trending down from a #high in 2009. This is #data available on #Statista.
https://www.statista.com/statistics/267401/anti-semitic-violence-since-1989/
According to the Tel Aviv University #stats via Statista, there have been a total of 12,492 "violent anti-Semitic incidents" #worldwide since 1989. Unfortunately the term "incident" is not defined and neither is the #violence #qualified, so there's a limit to what can be inferred from this #data.
However, the #numbers can be understood. 12,492 is an average of 403 incidents a year, over the 31 year period. That's an average of 34 a month, or about 8 a week, worldwide, over 31 years.
If we take today's #Jewish #population of around 14,000,000 into account, that means that on average 0.0029% of #Jews are #victims of anti-Semitic violence each year, which means that 99.9971% of Jews are not victims of it.
If we assume all incidents are perpetrated by #Gentiles and also consider the #Gentile population is around 7,786,000,000, that means that on average only 1 out of every 19,320,100 Gentiles commits an act of anti-Semitic violence each year. That's 0.000005176% of Gentiles, meaning that 99.999994824% of Gentiles don't commit acts of anti-Semitic violence.
Great news for everybody, except those who use "#antisemitism" as a #political #tool and those organisations like the #ADL whose #financial existence relies on "antisemitism" remaining a significant #problem.
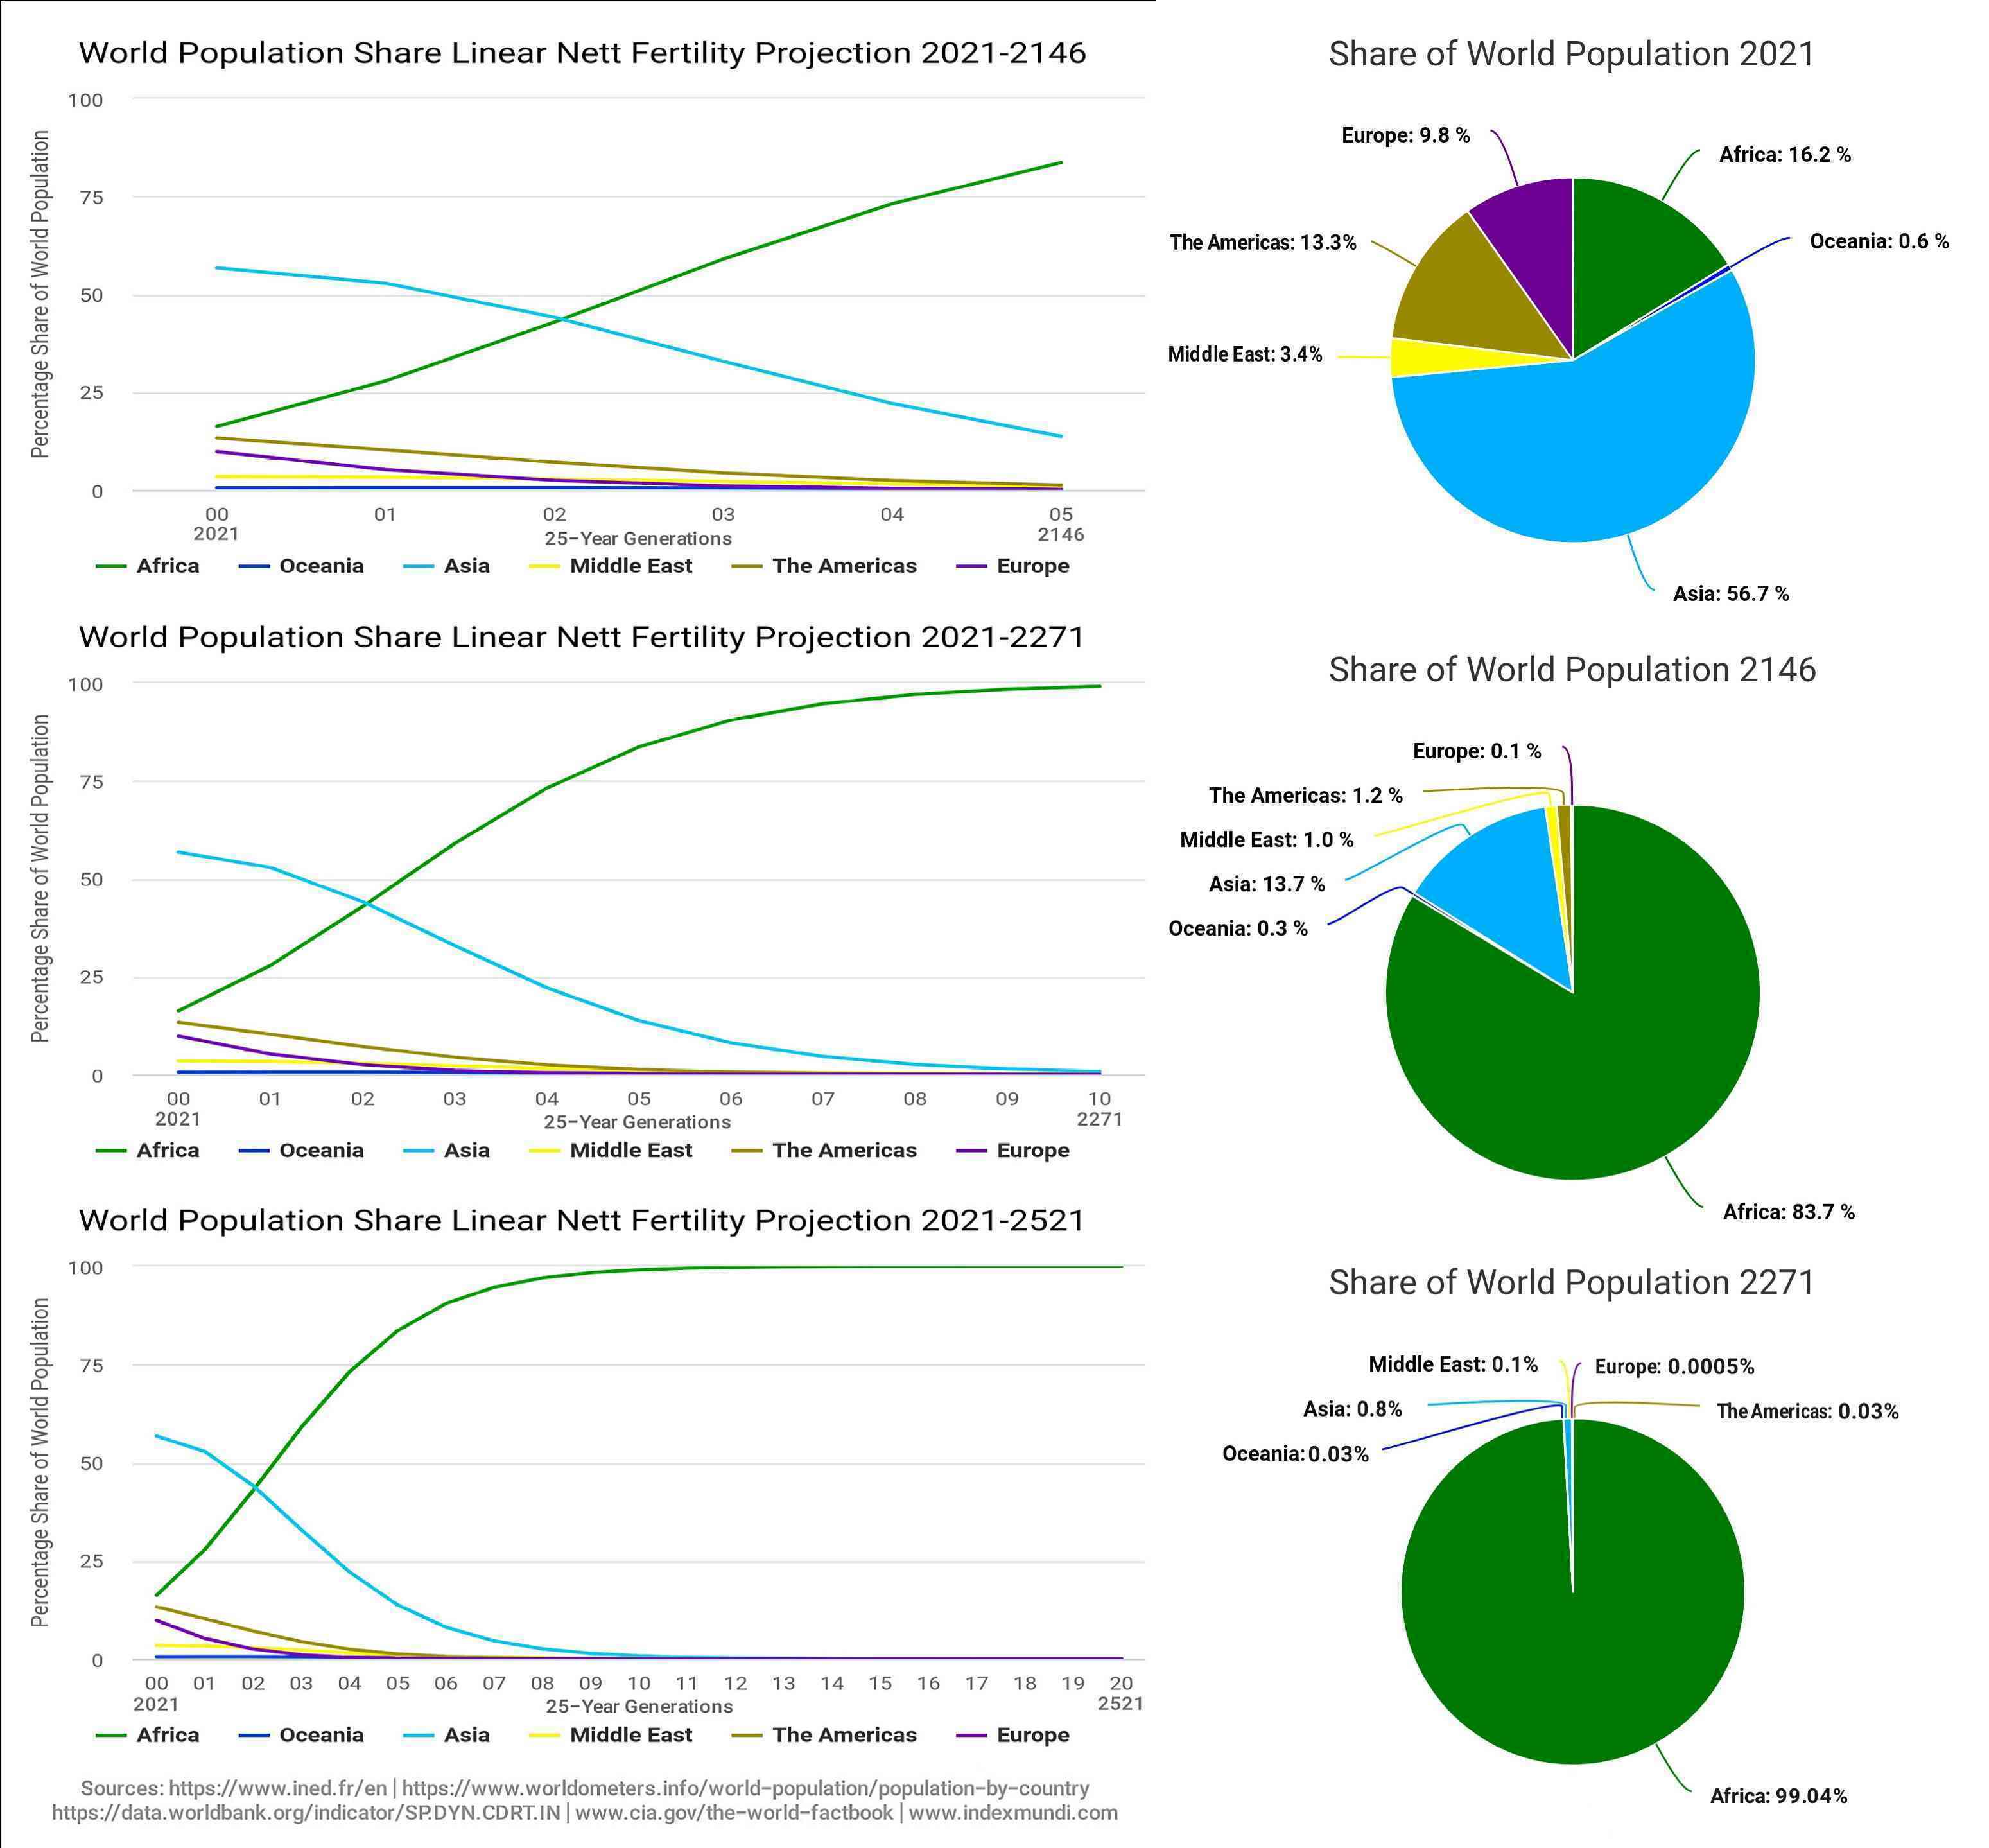
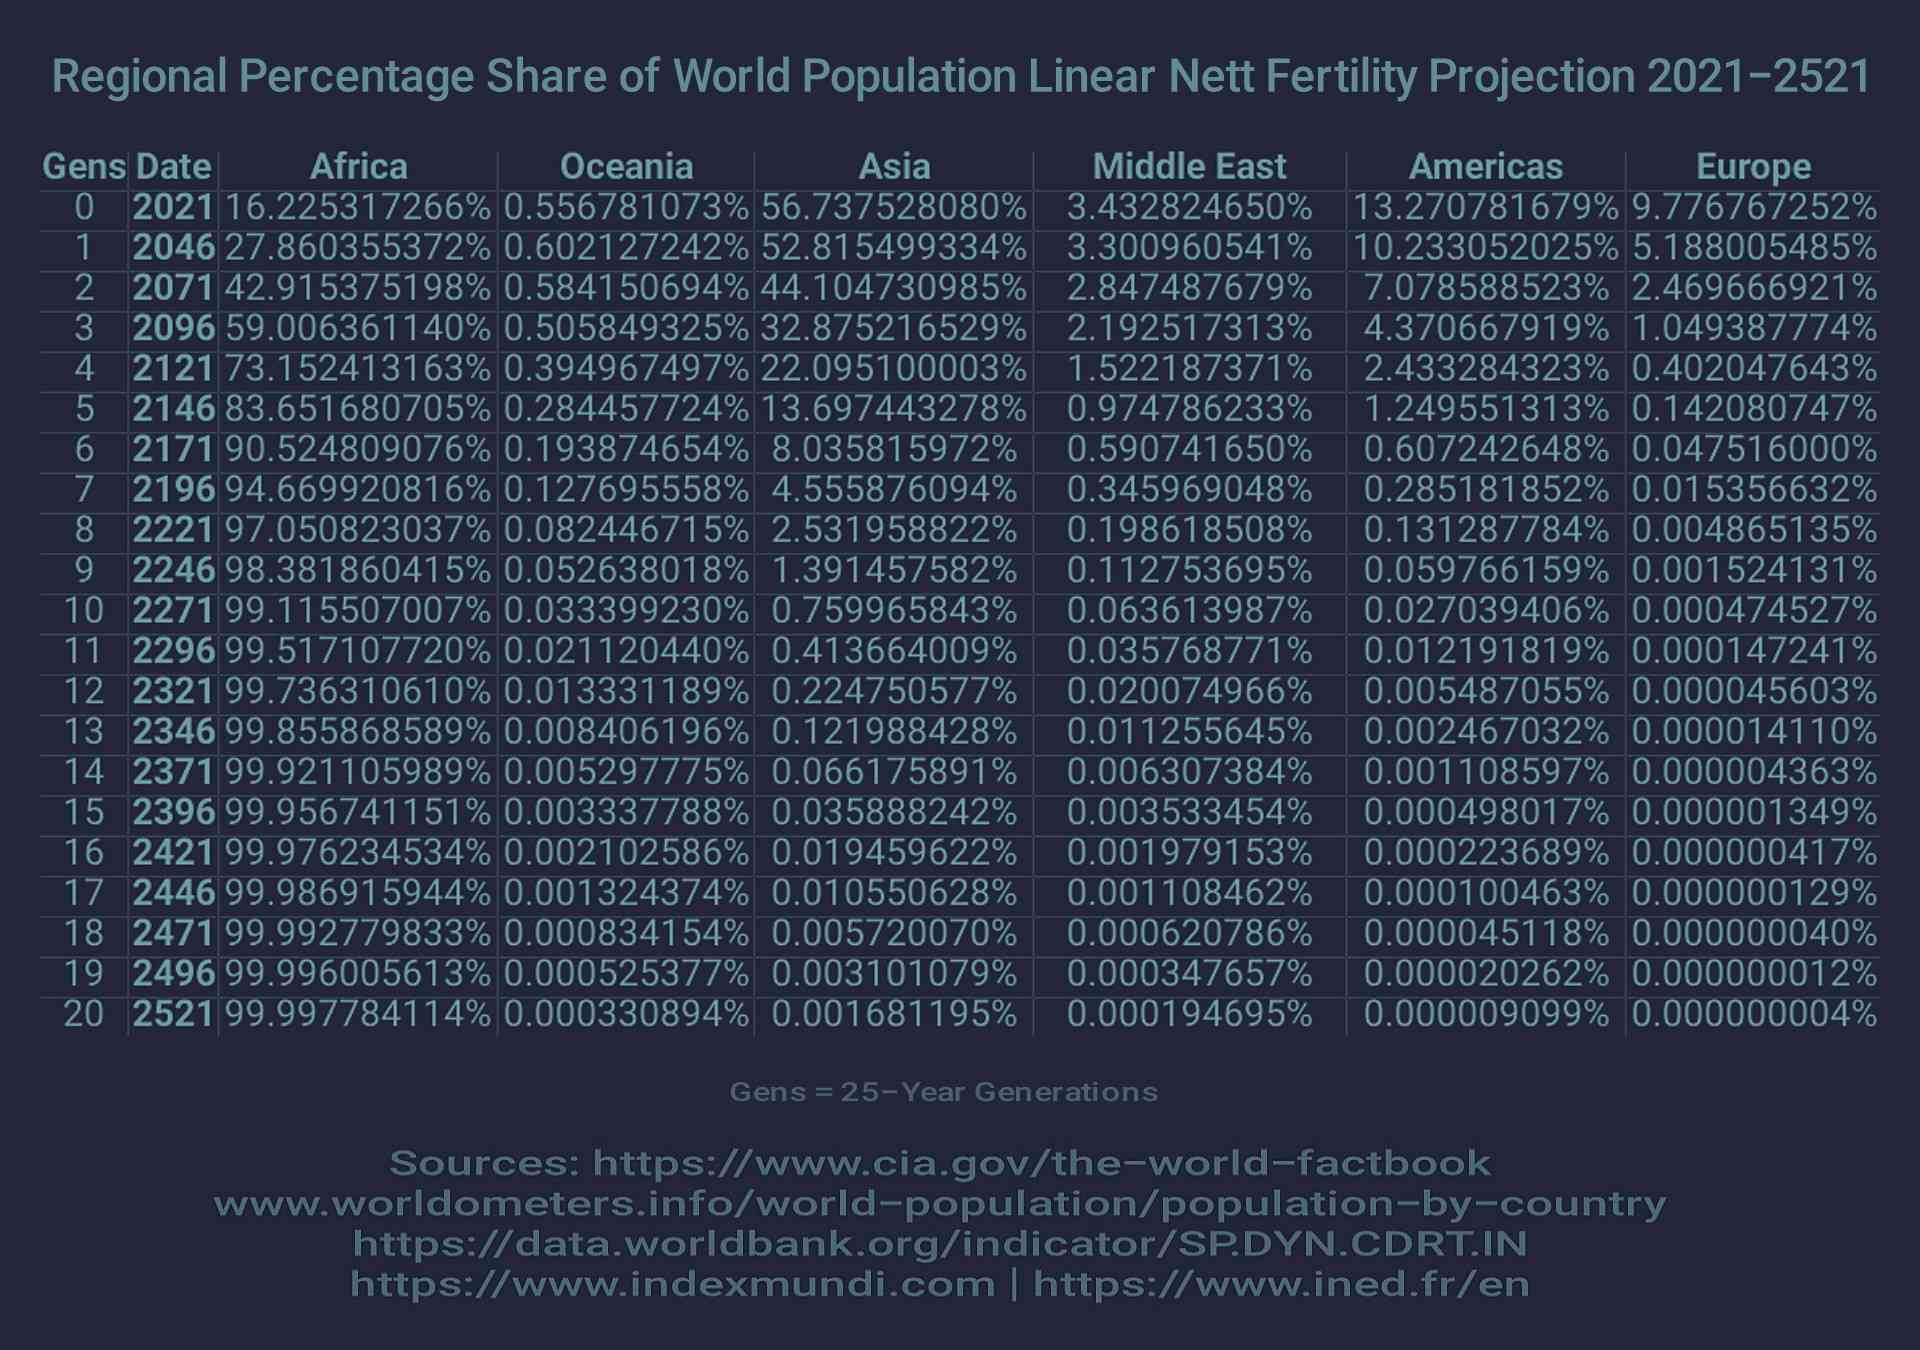
Linear statistical projection of current fertility trends per #continent region, demonstrating expected change in relative world population share over the next 20 #sociological generations if current trends remain unchanged.
#population #worldpopulation #birth #populationreduction #fertility #baby #populationcontrol #fertilityrate #UK #USA #africa #europe #europeans #asia #theamericas #middleeast #EU #oceania #whitebirthrate #african #africanbirthrate #reproduction #fertilityrates #birthcontrol #abortion #birthrates #endocrinology #pollution #socialengineering #extinction #family #familyvalues #immigration #replacementmigration #elites #contraception #familyunit #graphs #charts #statistics #data #analysis #information #predictions #stats
47 Comments
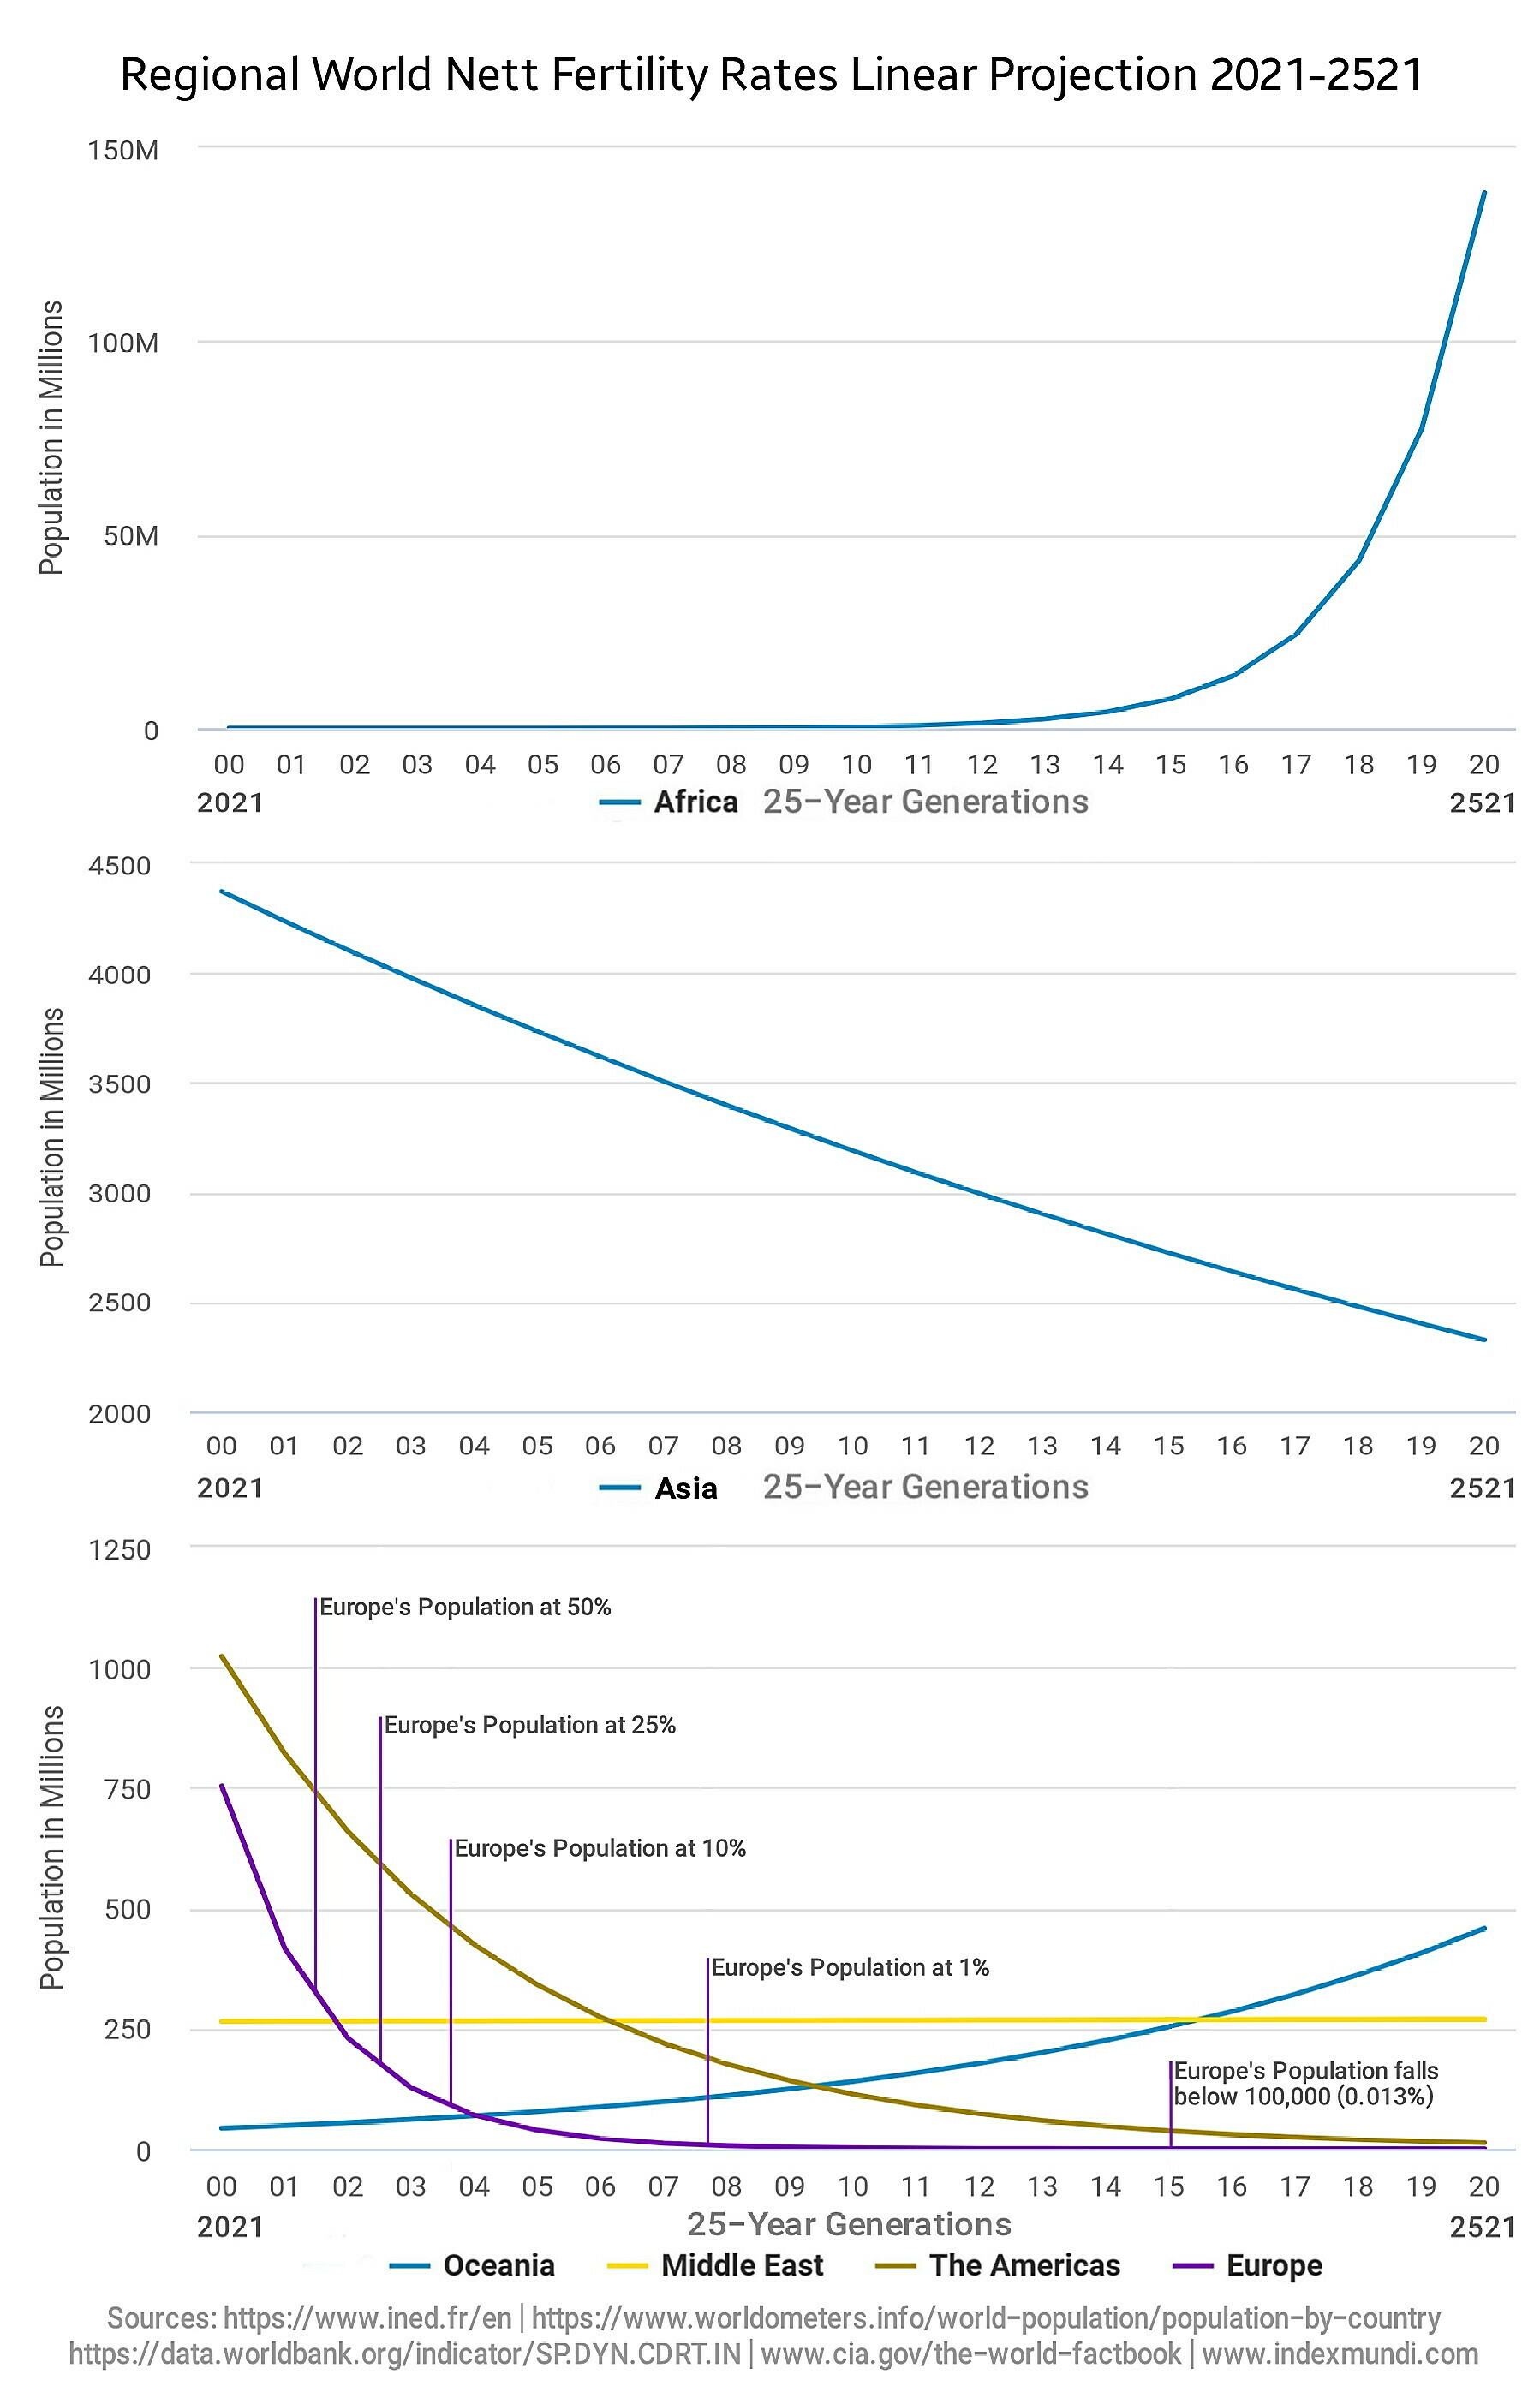
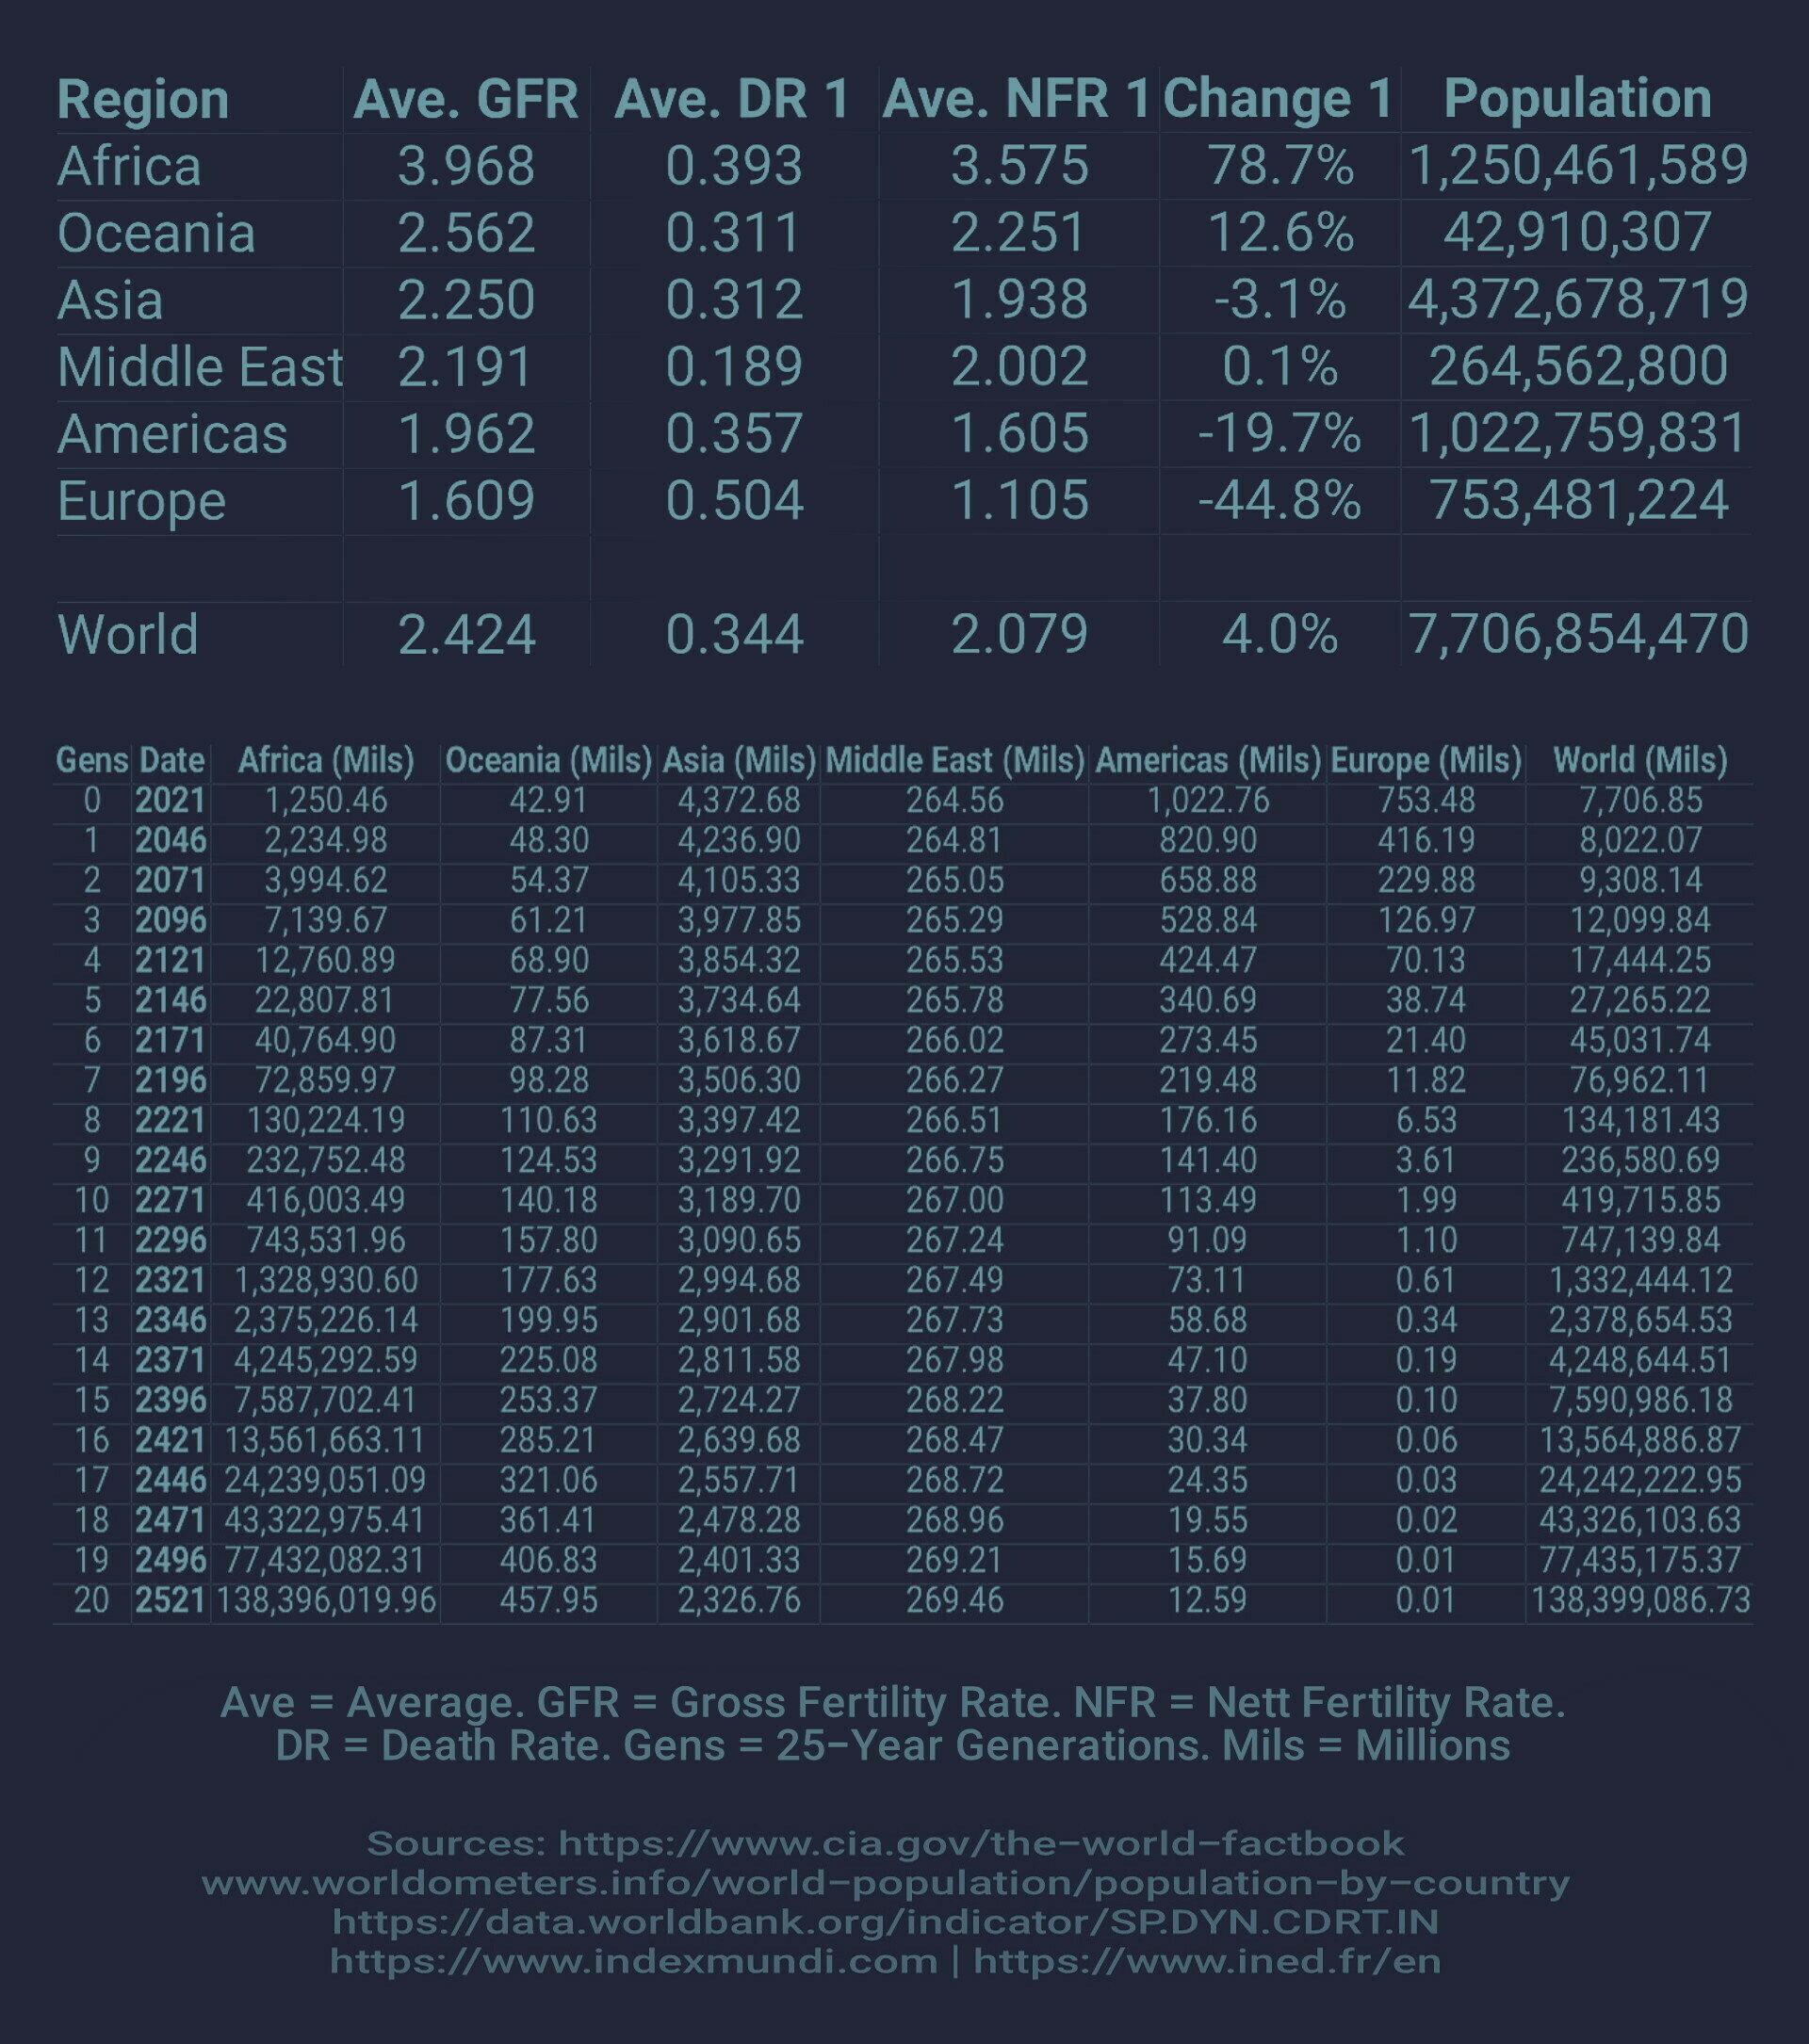
This is an #urgent message to all people of proto-Indo-European descent. All "White" peoples, Europeans, #Germanic peoples, #Celtic peoples, #Slavic peoples and all peoples who identify as "White" or Indo-European.
Fertility Rates are dire. If they are not corrected soon, White peoples will cease to exist.
#fertility #birth #birthrates #birthrate #whitepeople #whitelivesmatter #indoeuropean #protoindoeuropean #europe #asia #theamericas #africa #middleeast #oceania #children #babies #baby #pregnant #abortion #pregnancy #european #asian #american #middleeastern #african #oceanian #fertilityrate #survival #data #statistics #graphs #charts #information #family #longevity #civilization #westerncivilization #thewest #west #westernfertility
13 Comments


