#stats

tpq1980@iviv.hu
tpq1980@iviv.hu

Analysis of UK 2007 to 2019 fertility #correlation between ethnic groups.

Something happens around 2012 that negatively influences all group's fertility, some more than others.

The fact that each ethnic group's fertility rate change is so very highly correlated despite significant differences in geographic distribution suggests to me an external, society-wide influence.

#uk #britain #ukpopulation #ethnicity #demographics #ukdemographics #socialengineering #ethnography #ukethnography #england #white #black #asian #indoeuropean #data #african #multiculturalism #chemical #endocrinedisruptors #analysis #usa #graphs #charts #mathematics #eu #statistics #stats #ukgovernment #britishgovernment #fertilityrates #multiracialism #demography #gb #ethnicgroups #populationdata

tpq1980@iviv.hu

#UK population share by #ethnicity 2007 to 2069, using UK government fertility & #population data 2007 to 2019 & projected to 2069 using linear #growth modified by #population growth #trends derived from the 2007 to 2019 #data.

When did the #British people #vote for demographic change? When was the #referendum? Which party ran on a platform of demographic change & was subsequently #elected to office?

#britain #ukpopulation #info #demographics #ukdemographics #ukethniccomposition #ethnography #ukethnography #england #white #black #asian #indoeuropean #african #multiculturalism #birthrates #demographicchange #analysis #graphs #charts #mathematics #statistics #stats #ukgovernment #britishgovernment #immigration #multiracialism #demography #ethnicgroups #populationdata

tpq1980@iviv.hu

UK Birthrates by Ethnic Group per 100,000 of Population from 2007 to 2019 based on UK government data.

This analysis demonstrates that African & Asian heritage citizens of the UK have reproduced at an average 1.89x (189%) greater rate than Indo-European (White) autochthonous British heritage citizens.

#birthrates #indoeuropean #asian #african #whitebirthrate #ukbirthrate #europeanbirthrate #europeans #brits #british #england #english #whites #whiteprivilege #fertilityrate #fertility #fertilitycrisis #lowbirthrate #study #information #stats #statistics #data #analysis #charts #graphs #un #wef #autochthonous #reproduction #uk #baby #children #offspring #white #pregnant #pregnancy #immigration #multiculturalism #multiracialism

tpq1980@iviv.hu

Origins of Illegal Migration into the USA 2022.

I was surprised to discover that Asia is the third largest source of Illegal migration, only 3 percentage points behind Central America.

#usa #unitedstates #america #US #illegalaliens #illegalimmigration #illegalimmigrants #southernborder #ussouthernborder #mexico #asia #centralamerica #southamerica #europe #caribbean #africa #oceania #canada #unitedstatesofamerica #map #maps #worldmap #data #information #stats #statistics

opensciencedaily@diasp.org

China expected to add up to 99GW of solar PV every year through 2025, Europe now its largest export market


China is expected to add 83 – 99GW of PV capacity every year from 2022 to 2025, while Europe is now its largest export market for solar products, according to a China Photovoltaic Industry Association (CPIA) report on the outlook for the PV industry over the next few years.
https://www.pv-tech.org/china-expected-to-add-up-to-99gw-of-solar-pv-every-year-through-2025-europe-now-its-largest-export-market/
#stats, #european, #news, #china, #cells, #cpia, #solar, #distributed, #deployment


tpq1980@iviv.hu

I just wanted to try to #contextualise the notion of "antisemitism", so people who are concerned about it can understand the #phenomenon more accurately.

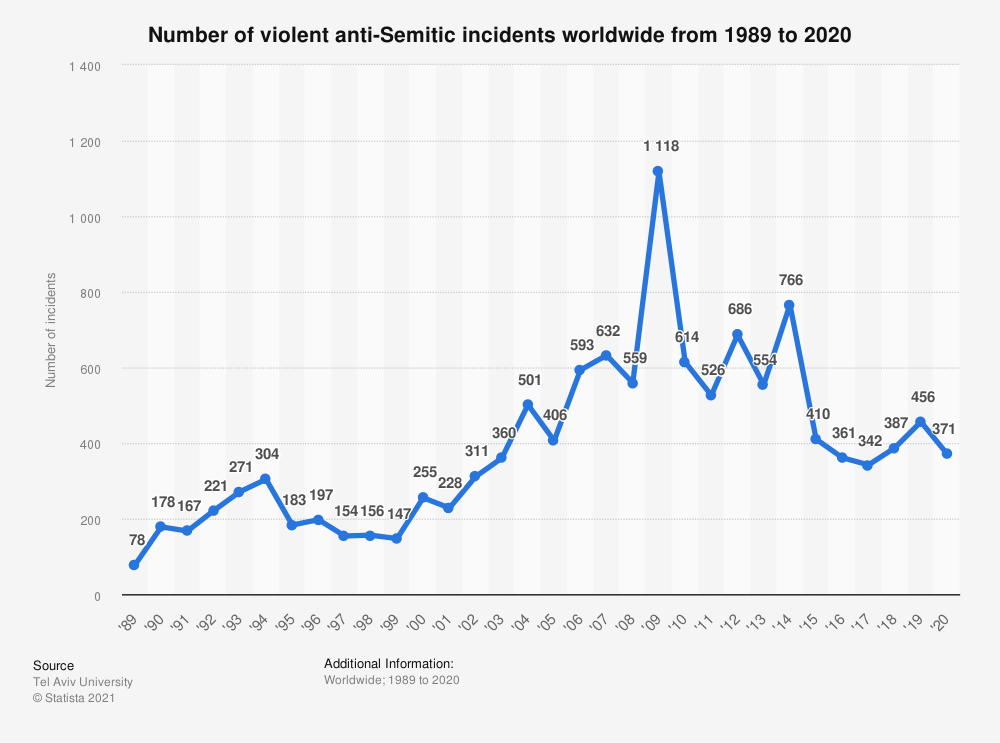
According to #statistics published by Tel Aviv #University, #violent anti-Semitic attacks are #trending down from a #high in 2009. This is #data available on #Statista.

https://www.statista.com/statistics/267401/anti-semitic-violence-since-1989/

According to the Tel Aviv University #stats via Statista, there have been a total of 12,492 "violent anti-Semitic incidents" #worldwide since 1989. Unfortunately the term "incident" is not defined and neither is the #violence #qualified, so there's a limit to what can be inferred from this #data.

However, the #numbers can be understood. 12,492 is an average of 403 incidents a year, over the 31 year period. That's an average of 34 a month, or about 8 a week, worldwide, over 31 years.

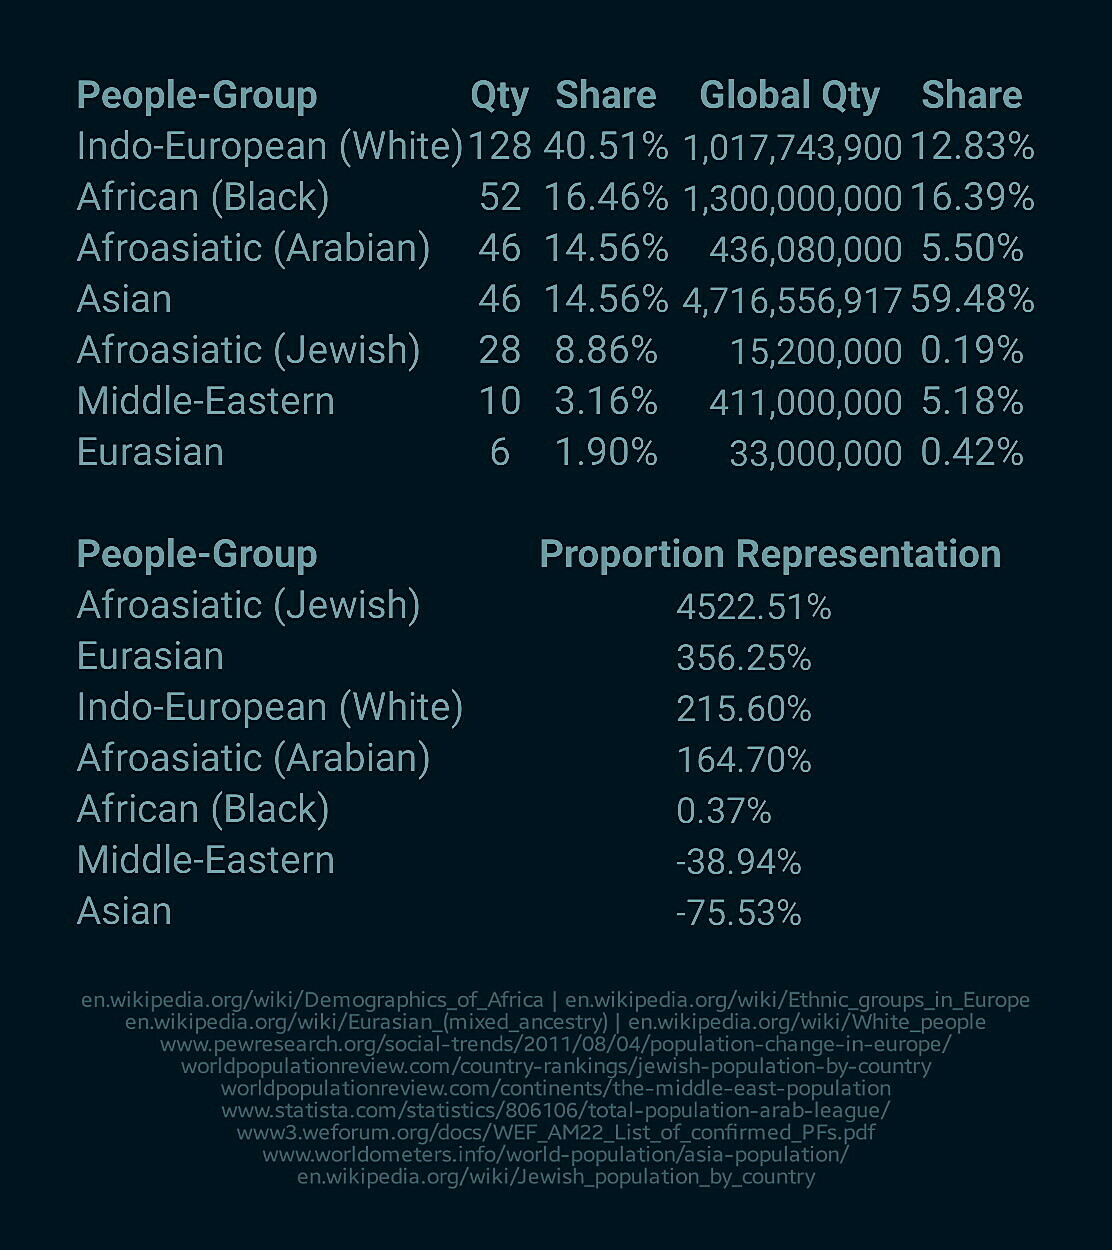
If we take today's #Jewish #population of around 14,000,000 into account, that means that on average 0.0029% of #Jews are #victims of anti-Semitic violence each year, which means that 99.9971% of Jews are not victims of it.

If we assume all incidents are perpetrated by #Gentiles and also consider the #Gentile population is around 7,786,000,000, that means that on average only 1 out of every 19,320,100 Gentiles commits an act of anti-Semitic violence each year. That's 0.000005176% of Gentiles, meaning that 99.999994824% of Gentiles don't commit acts of anti-Semitic violence.

Great news for everybody, except those who use "#antisemitism" as a #political #tool and those organisations like the #ADL whose #financial existence relies on "antisemitism" remaining a significant #problem.

tpq1980@iviv.hu